Introduction
The Indian real estate sector has evolved into a ₹82 trillion economy, where informed decisions depend on understanding complex market dynamics across diverse property segments. Real Estate Data Intelligence enables analysts to track 6.2 million property registrations annually across Mumbai, Delhi, Bangalore, Hyderabad, and Chennai.
Through structured intelligence gathering, property stakeholders gain access to insights shaping nearly ₹3.8 trillion in asset value, analyze buyer behavior influencing 68% of investment decisions, and track market movements across 540,000 active property listings—strengthened further by Indian Property Market Forecast Residential vs Commercial insights to support sharper, data-driven strategies.
Our research reveals that organized market intelligence identifies opportunities worth ₹674 billion in Mumbai Metropolitan Region alone, supporting 3.8 million daily property searches and informing decisions across 16,400 real estate firms nationally.
Objectives
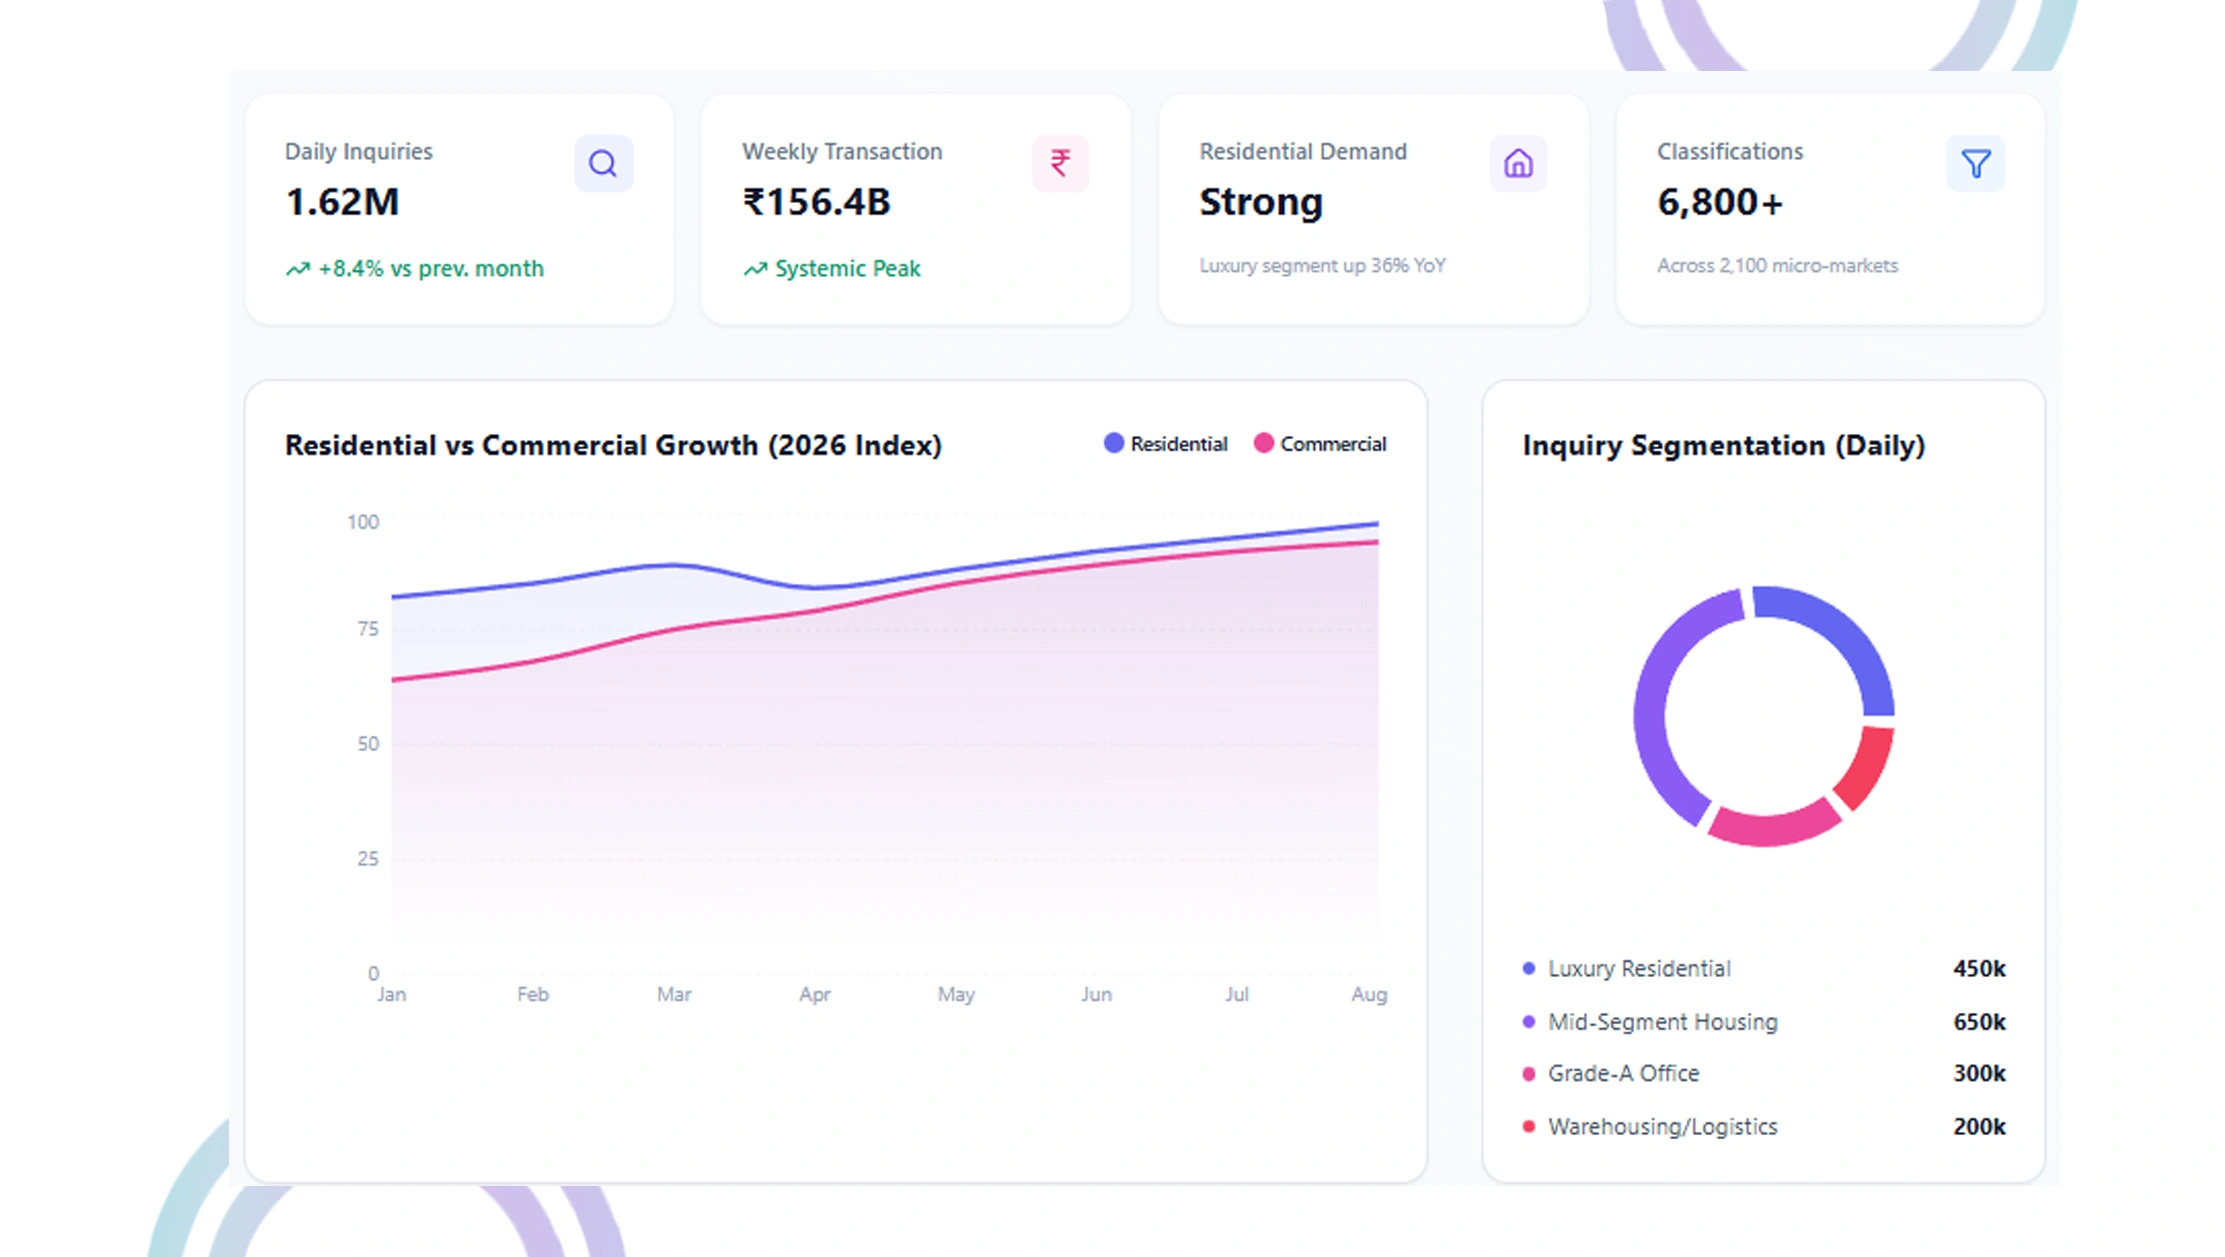
- Evaluate market patterns across the Indian Property Market Forecast Residential vs Commercial segments, processing 1.6 million daily property inquiries.
- Analyze How Residential and Commercial Markets Compare in India within a ₹156 billion weekly transaction ecosystem.
- Establish systematic frameworks for tracking Latest Real Estate Trends India 2026, monitoring 6,800 property classifications across 2,100 geographic zones.
Methodology
Our comprehensive five-layer framework for India's property landscape integrated automation with validation protocols, achieving 97.4% precision across all analytical parameters.
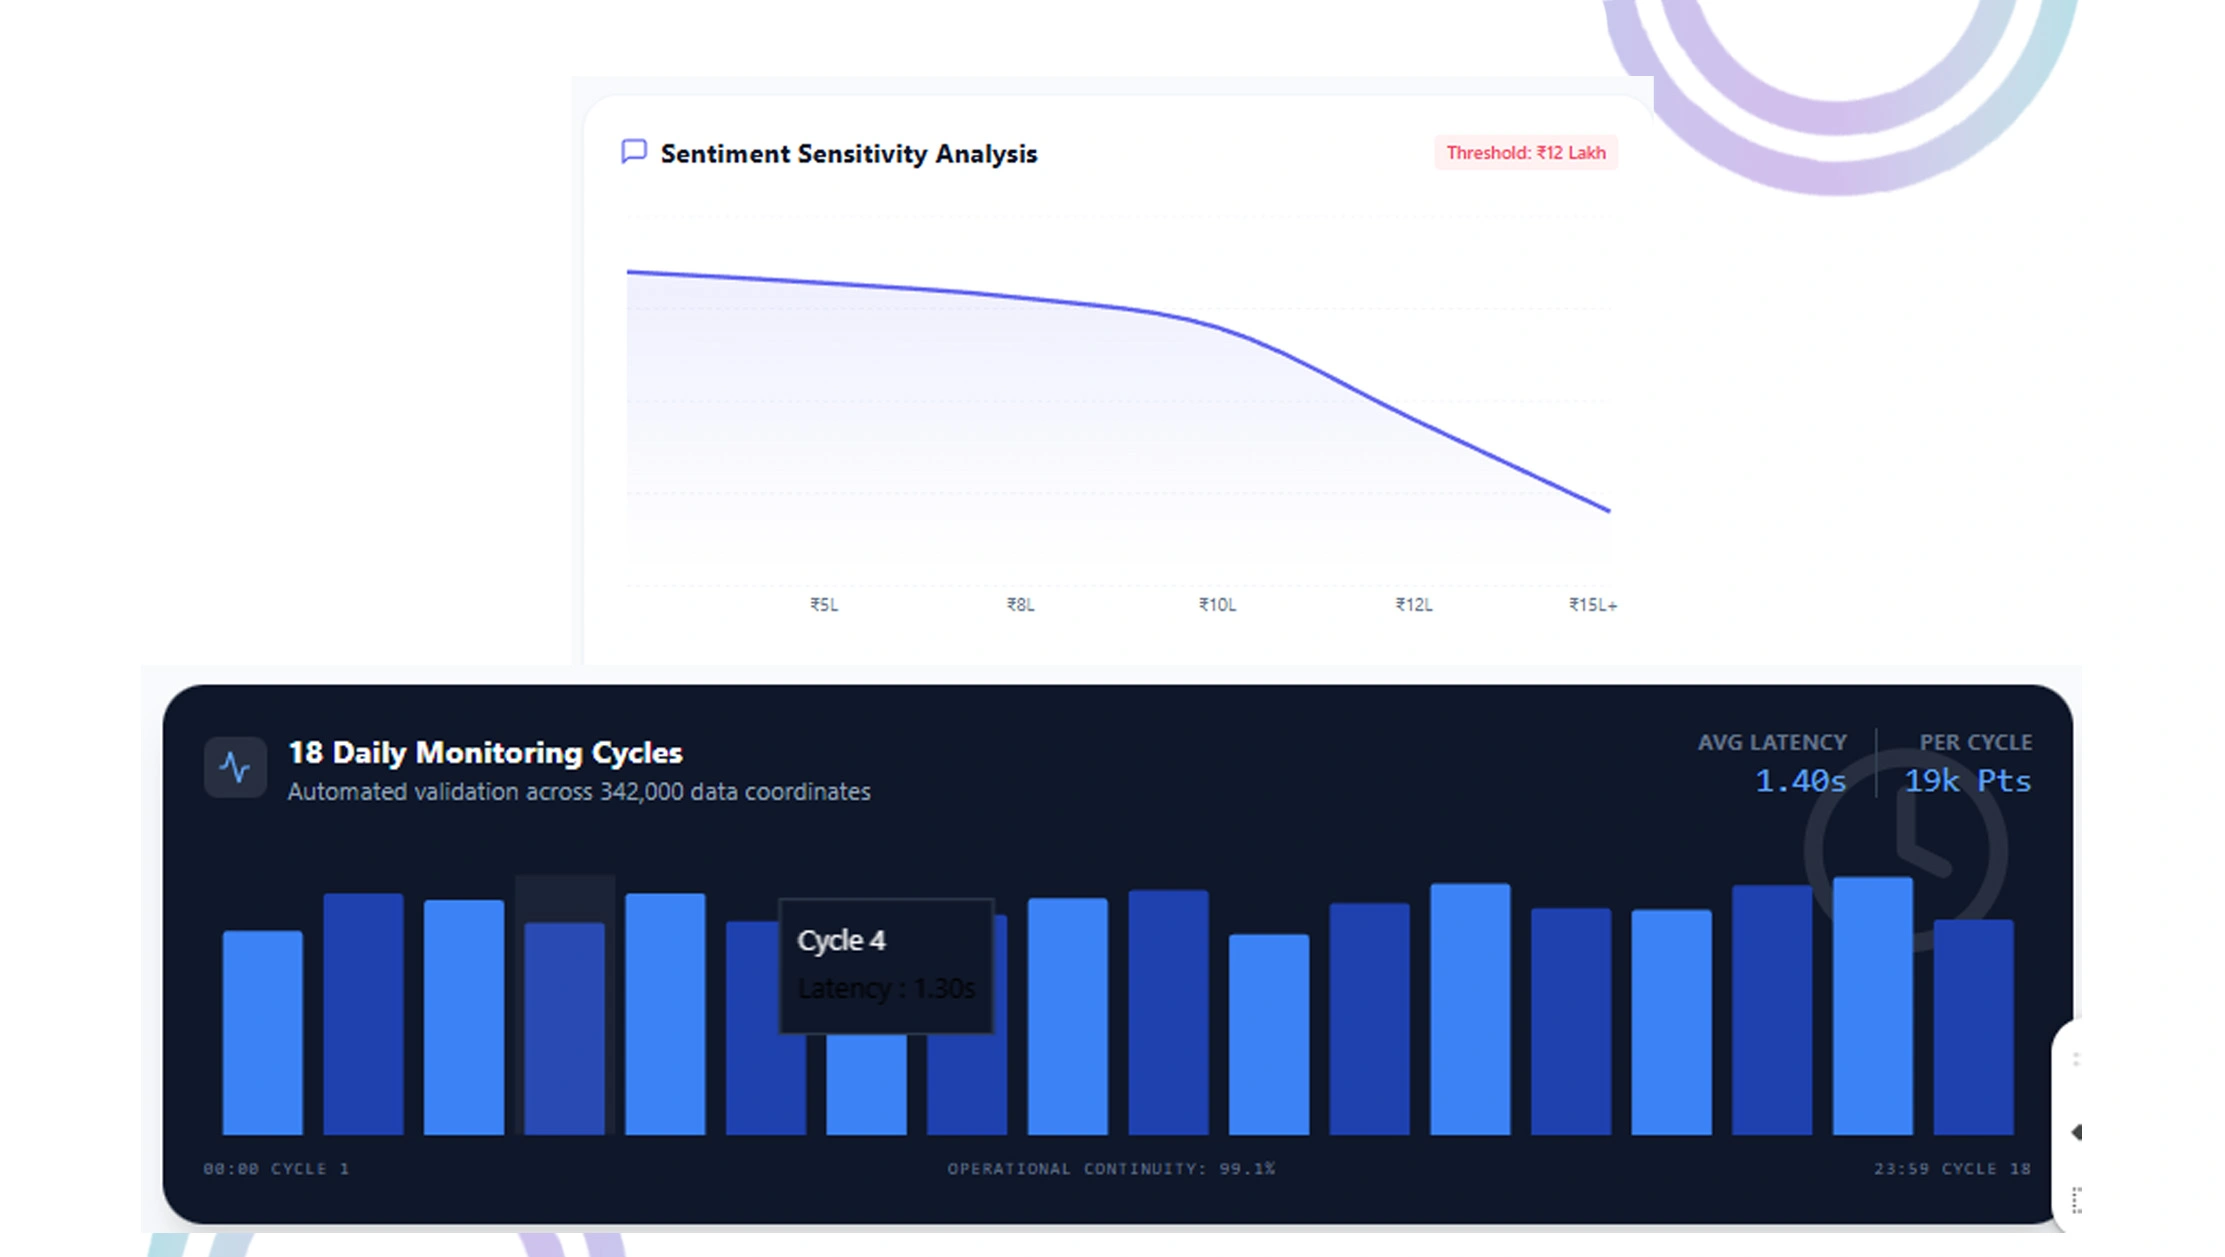
- Market Monitoring Framework: This infrastructure executed 18 daily monitoring cycles, capturing 342,000 data coordinates, and maintained 99.1% operational continuity with a 1.4-second query response time.
- Sentiment Analytics System: Our findings demonstrated that negative perception increased following price adjustments exceeding ₹12 lakh, while balanced pricing strategies generated favorable market response.
- Economic Intelligence Platform: We incorporated 23 external information sources, including infrastructure development APIs and demographic statistics, to support trend identification functionality.
Data Analysis
1. Metropolitan Property Market Landscape
The following table presents average pricing structures and market dynamics observed across major Indian property classifications on prominent platforms, reflecting Metro City Property Trends India.
| Property Classification | Mumbai Avg Price (₹ Lakh) | Tier-2 City Avg Price (₹ Lakh) | Variance Differential | Data Refresh Cycle |
|---|---|---|---|---|
| Residential Apartments | 124.6 | 42.8 | 65.6% | Every 1.8 hours |
| Commercial Office | 187.3 | 58.4 | 68.8% | Every 2.2 hours |
| Villa Properties | 246.9 | 73.2 | 70.4% | Every 1.5 hours |
| Retail Spaces | 156.4 | 51.7 | 66.9% | Every 2.8 hours |
| Industrial Warehouses | 98.7 | 34.6 | 64.9% | Every 3.1 hours |
2. Statistical Performance Evaluation
- Dynamic Market Activity Patterns: Analysis reflecting Latest Real Estate Trends India 2026 demonstrates commercial properties adjust valuations 156% more frequently—approximately 14 times daily, compared to residential properties at 5.8 revisions.
- Platform Differentiation Metrics: Examination reveals that premium property portals command 7.4% higher valuations in luxury residential and Grade-A commercial segments, while facilitating 36% more high-value transactions.
Consumer Engagement Analysis
We investigated buyer interaction patterns and their correlation with pricing approaches across property platforms to develop deeper market understanding, examining How Residential and Commercial Markets Compare in India.
| Engagement Pattern | Distribution | Avg Decision Timeline (Days) | Investment Impact (₹ Lakh) | Conversion Success (%) |
|---|---|---|---|---|
| Value Conscious Investors | 47.8% | 16.3 | -24.6 | 61.4% |
| Location Priority Buyers | 34.6% | 11.2 | +16.8 | 74.8% |
| Commercial Investors | 11.2% | 24.7 | -9.8 | 69.2% |
| Premium Segment Seekers | 6.4% | 7.8 | +42.3 | 86.7% |
Behavioral Intelligence Findings
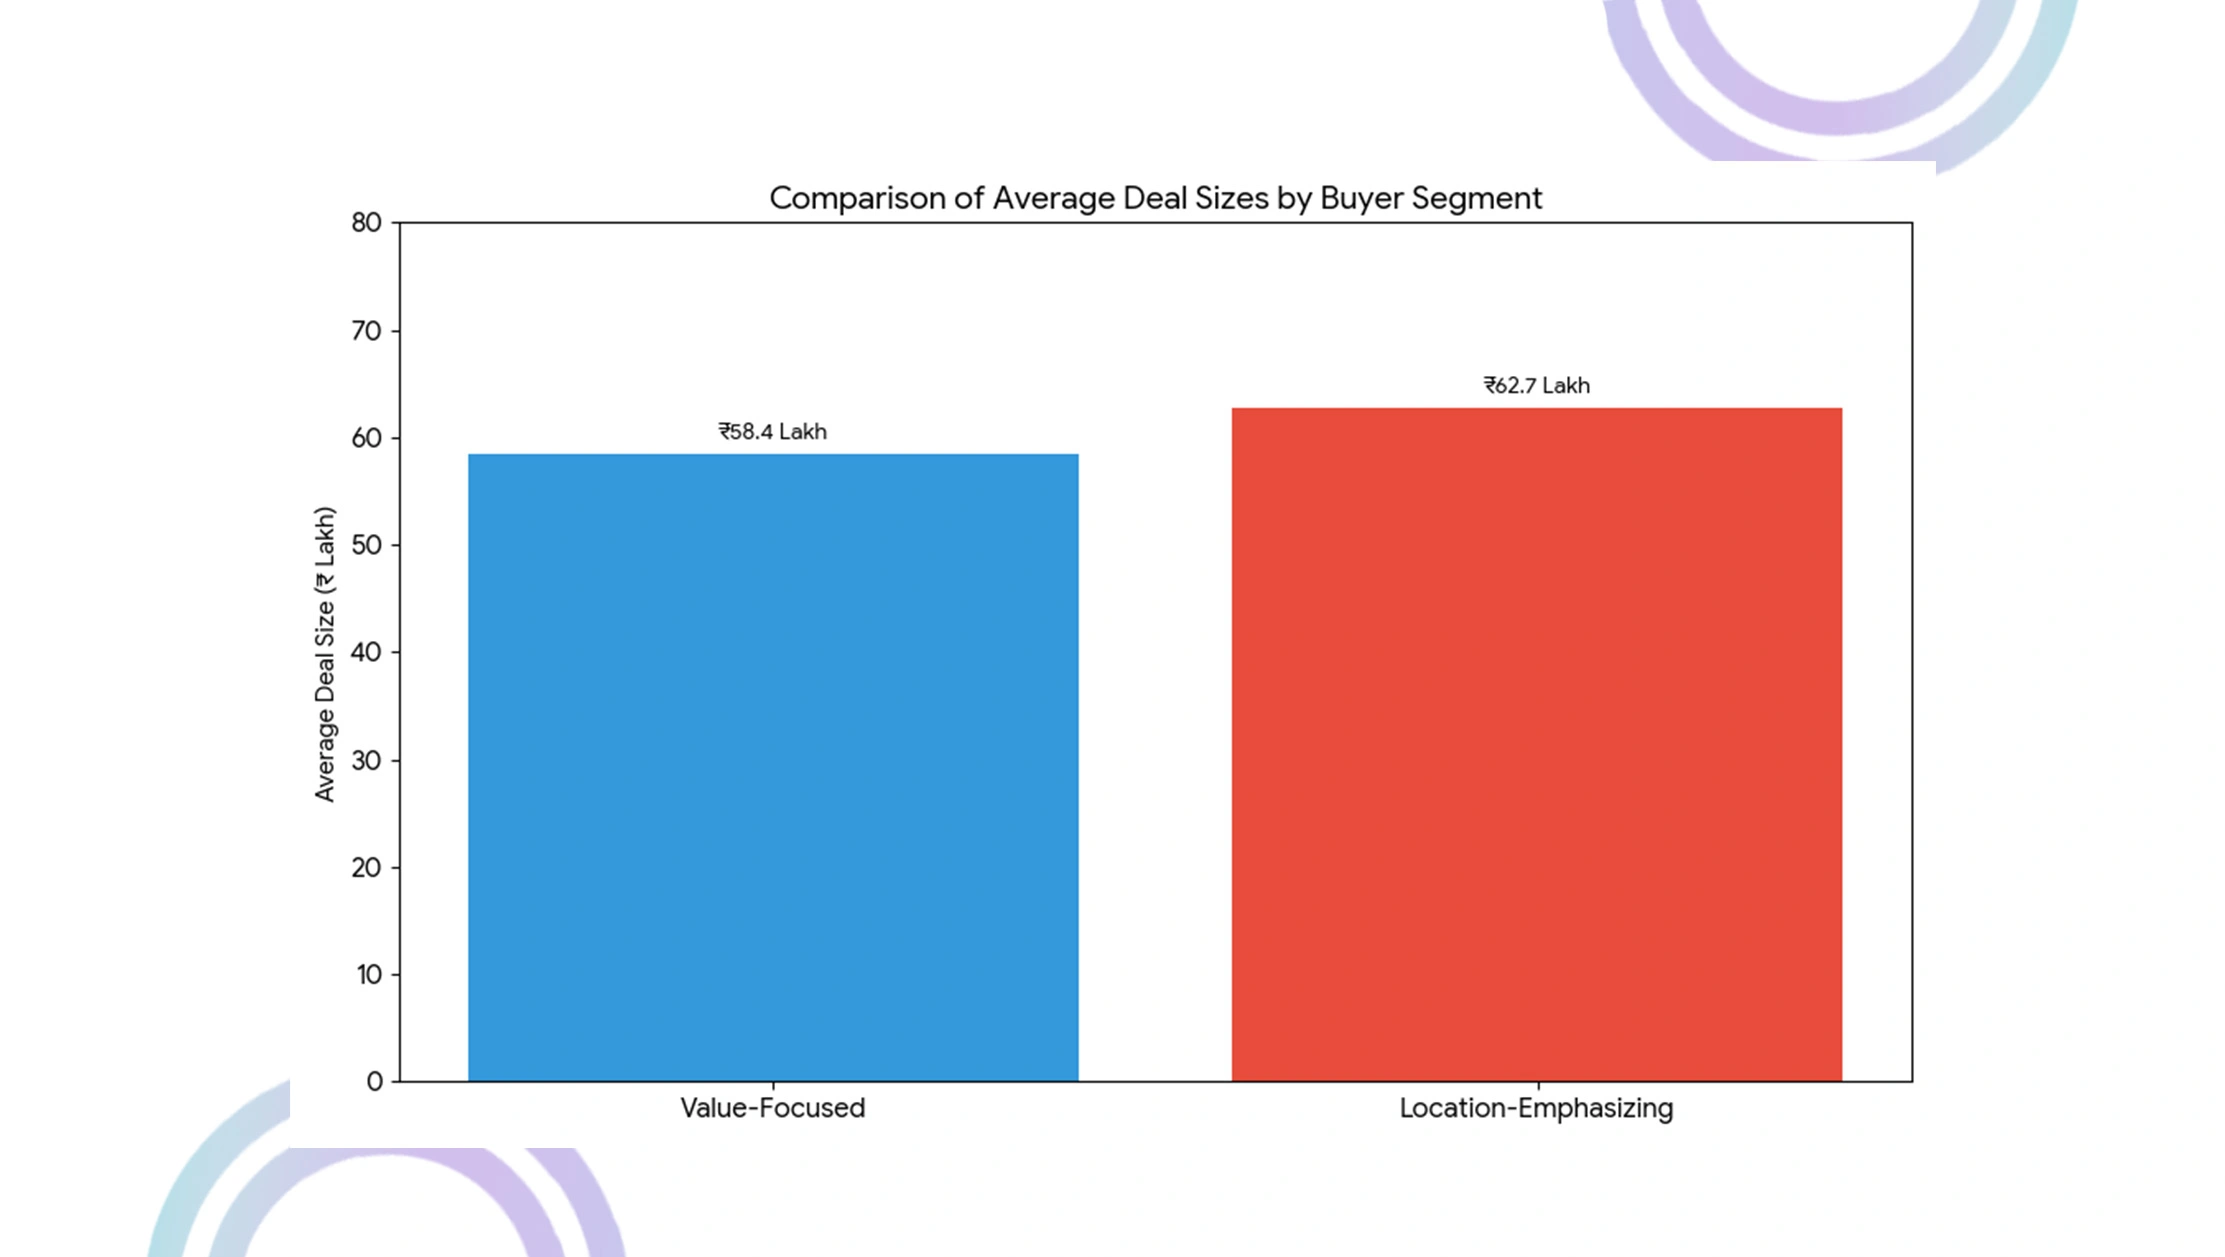
- Market Distribution Patterns: Research indicates that 47.8% of buyers represent ₹423 crores in annual value-focused transactions, yet demonstrate 31% lower repeat engagement at an average deal size of ₹58.4 lakh.
- Decision Framework Behavior: Our investigation reveals that location-emphasizing purchasers finalize transactions averaging ₹62.7 lakh in merely 11.2 days.
Market Excellence Assessment
- Algorithmic Valuation Implementation Results
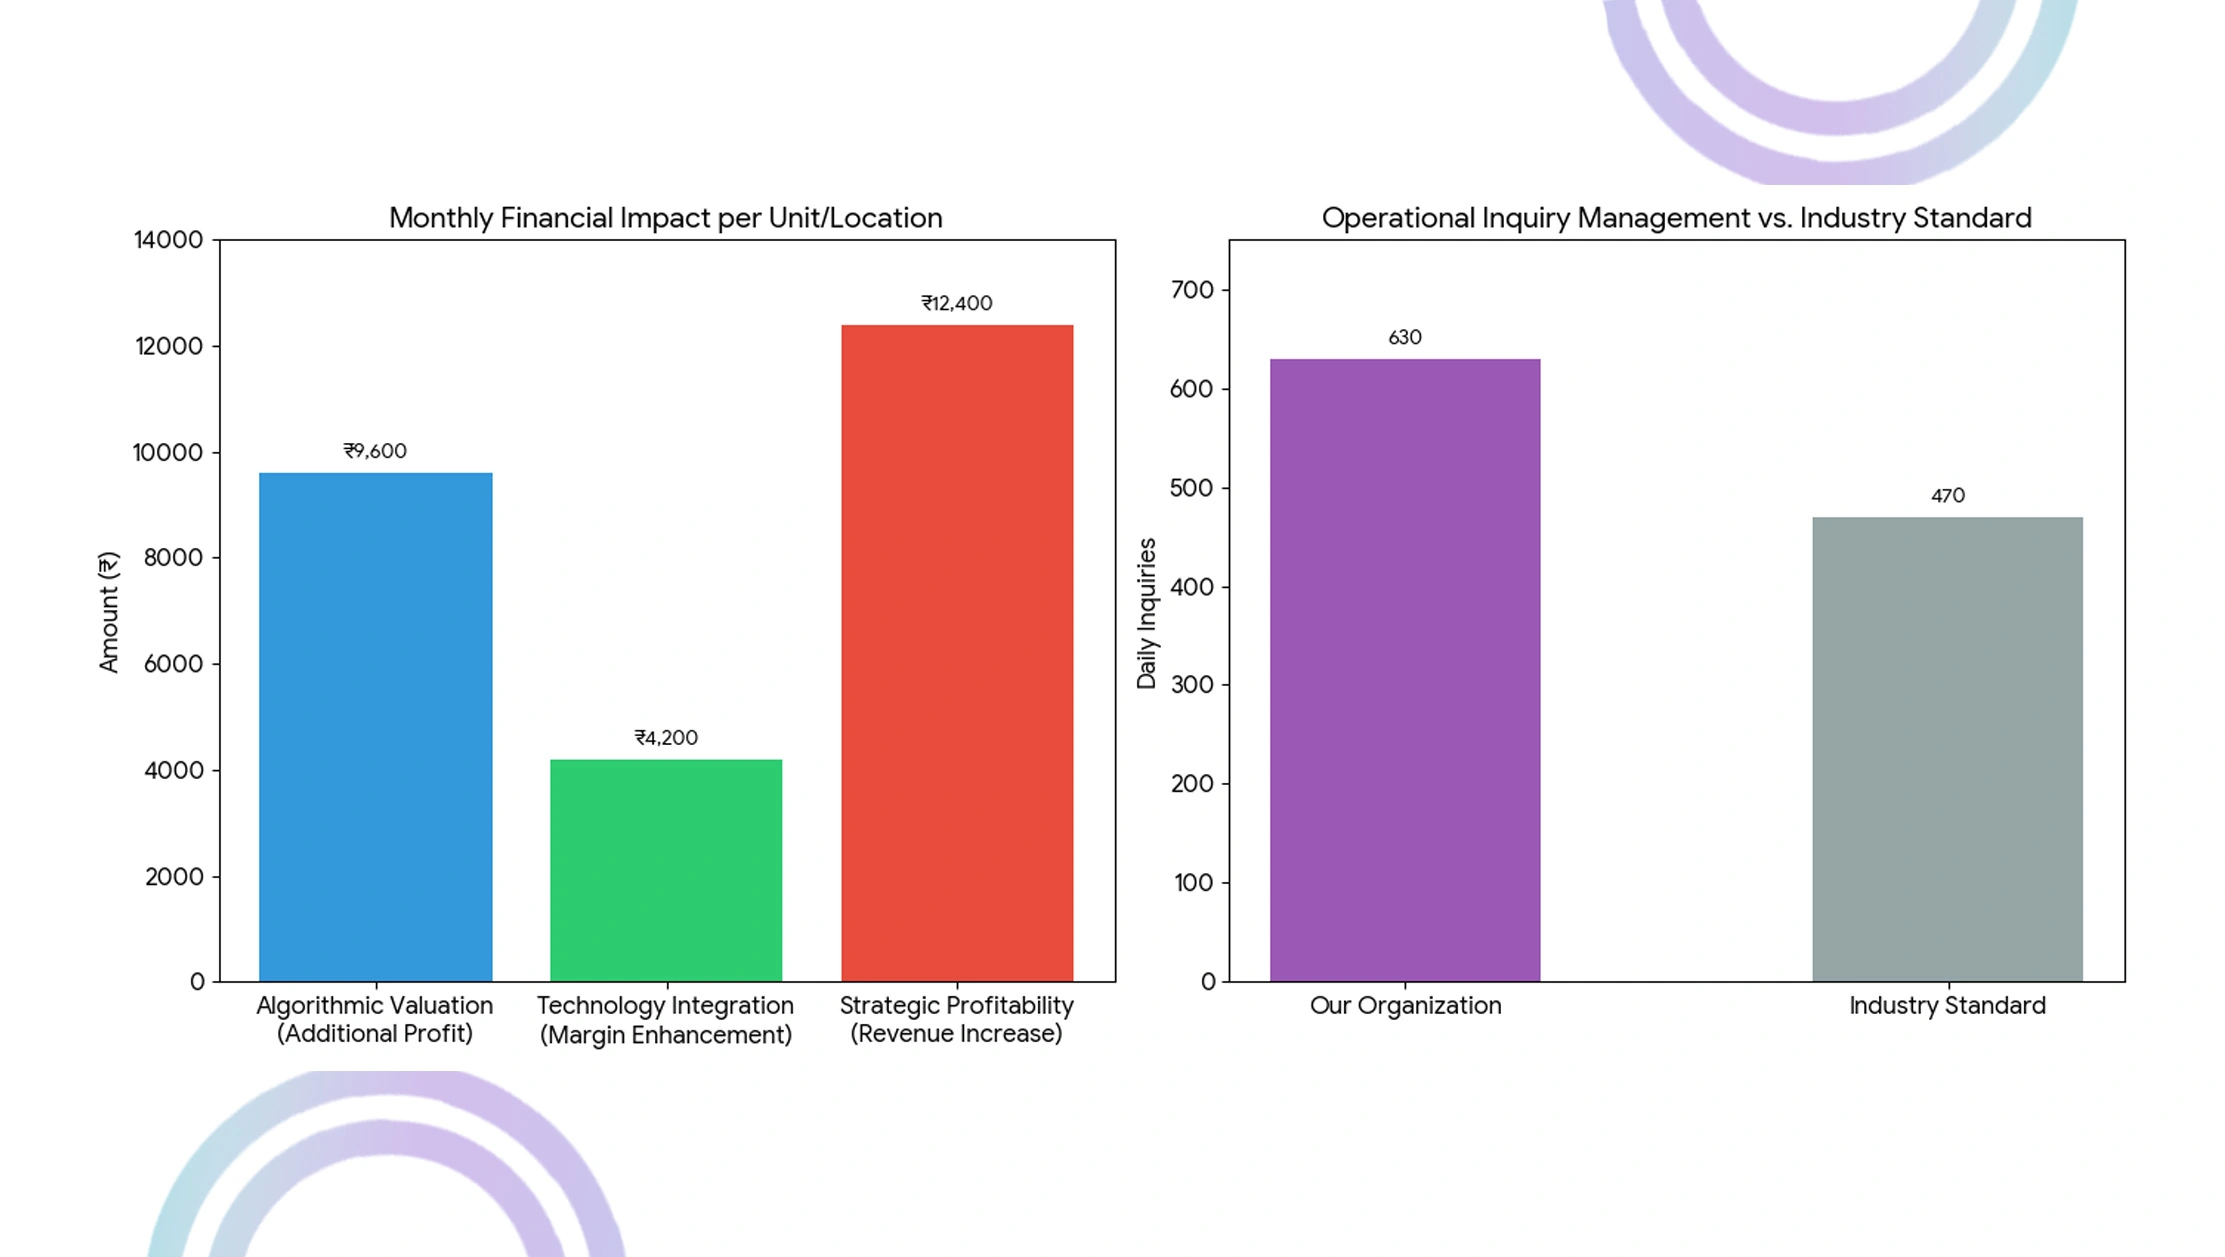
Market intelligence findings showed that dynamic valuation strategies boosted profit contributions by 38%, generating an additional ₹9,600 per month per property node through Real Estate Data Scraping Services insights. - Technology Integration Outcomes
Organizations adopting integrated platforms identified ₹4,200 in monthly margin enhancement while sustaining 97% market competitiveness. Operational efficiency increased 42%, with 630 daily inquiries managed—significantly above the 470 industry standard. - Strategic Profitability Enhancement
Firms utilizing advanced methodologies achieved a 95% success metric, optimizing competitive positioning and margins, with average monthly revenue increasing by ₹12,400 across 84 monitored locations, demonstrating strong City Wise Residential and Commercial Trends.
Implementation Obstacles
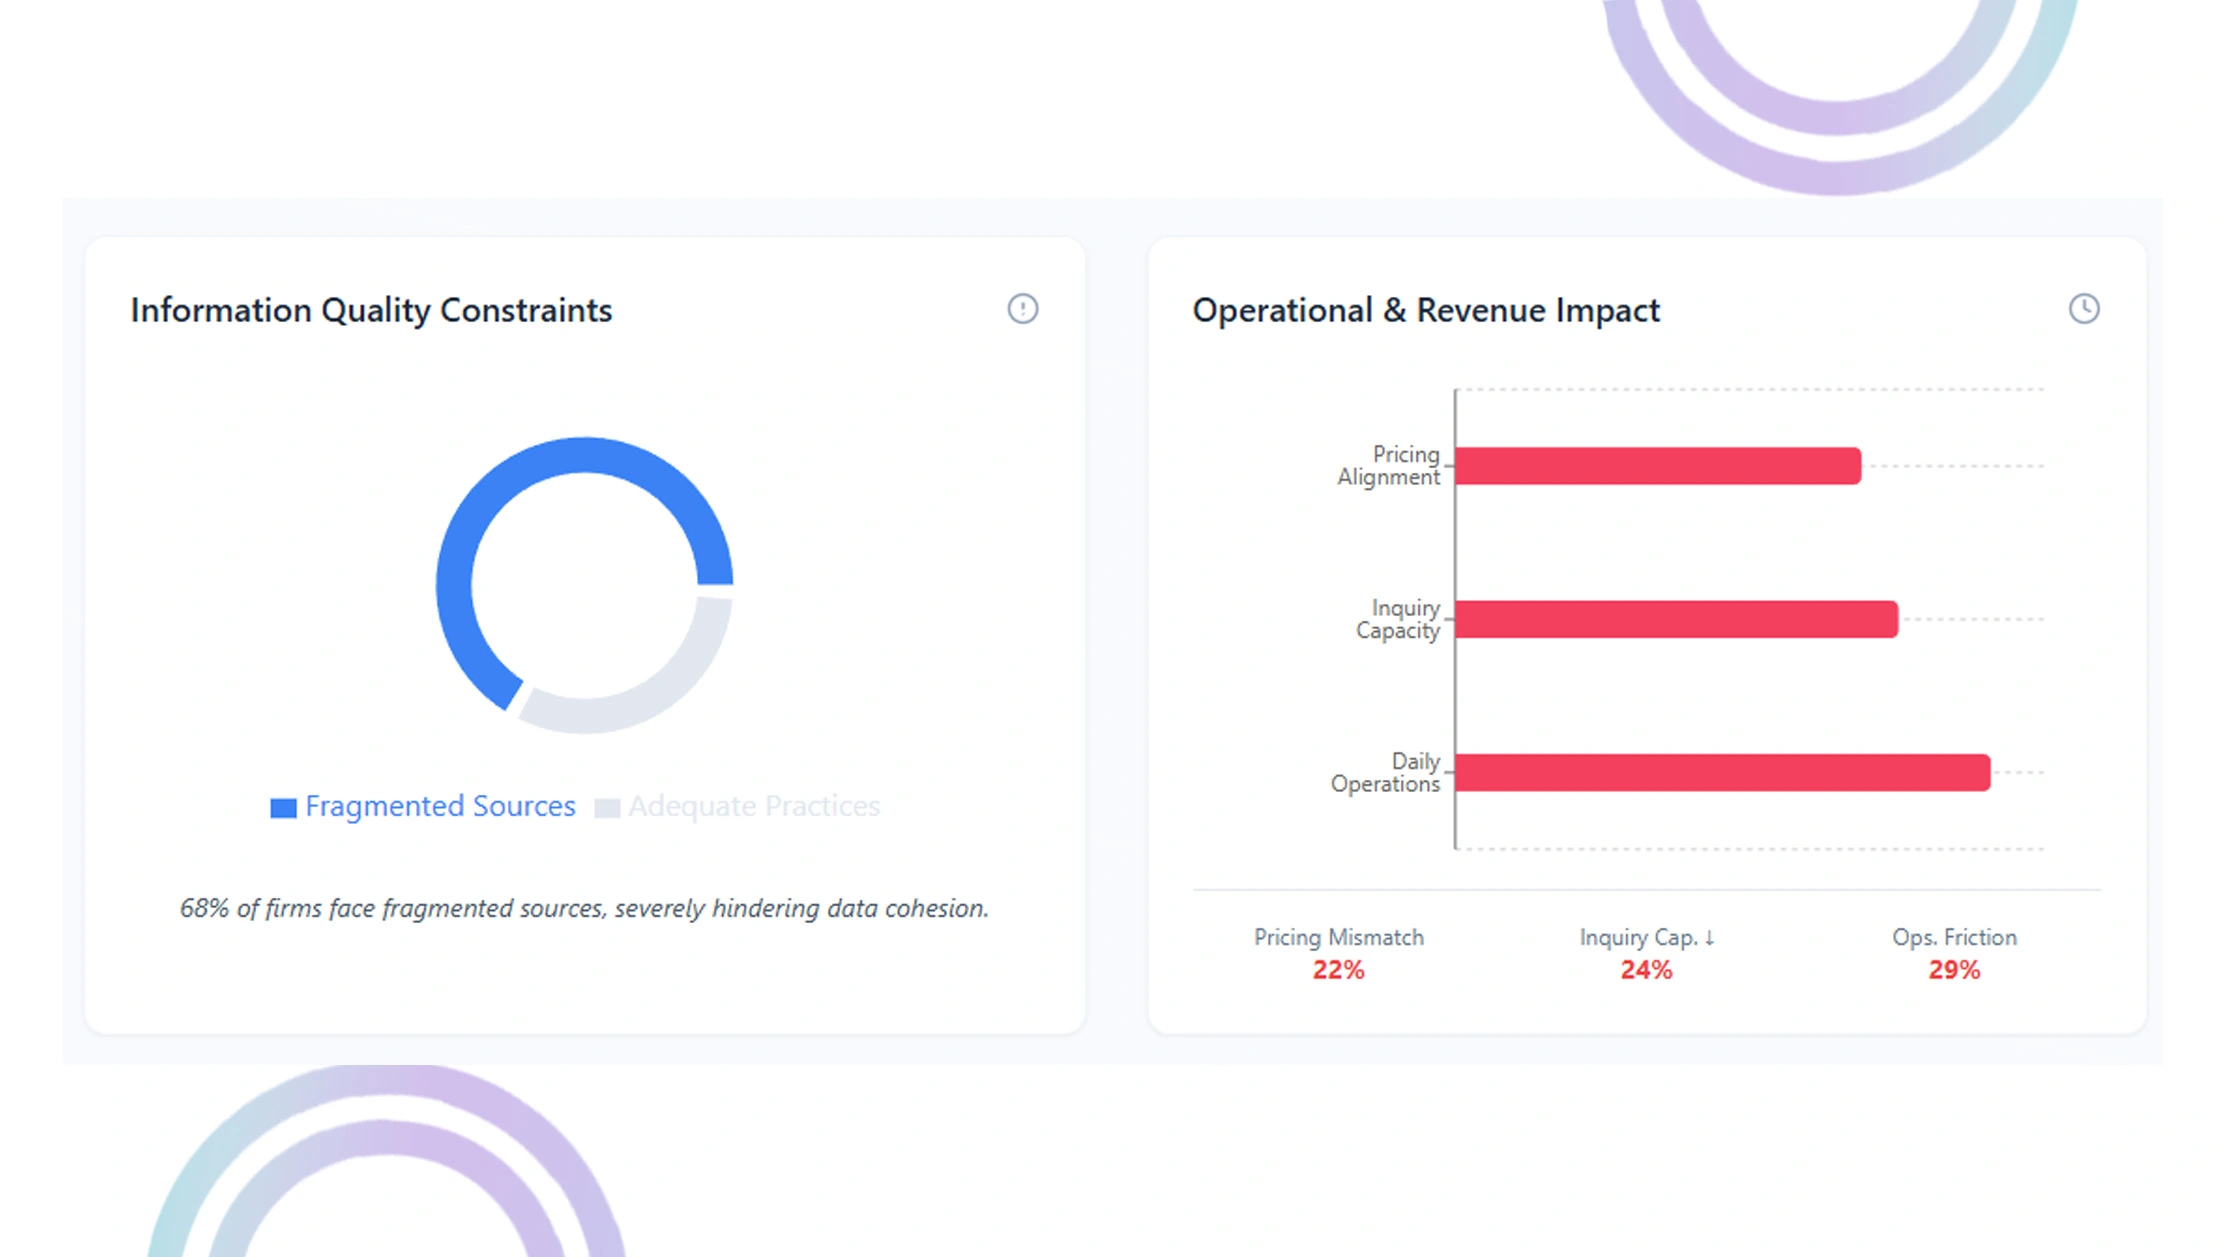
- Information Quality Constraints
Approximately 68% of property firms expressed challenges with fragmented information sources, with inadequate collection practices contributing to 22% of misaligned pricing strategies. - System Response Challenges
Nearly 48% of participants reported an average monthly loss of ₹3,200, as highlighted in the India Real Estate Trends Report, emphasizing the growing cost of operational inefficiencies. - Analytics Interpretation Barriers
Approximately 51% found it challenging to transform raw information into strategic insights, which affected 29% of their daily operations. Insufficient infrastructure for systematic analysis led to a 24% reduction in inquiry processing capacity.
Market Performance Catalysts
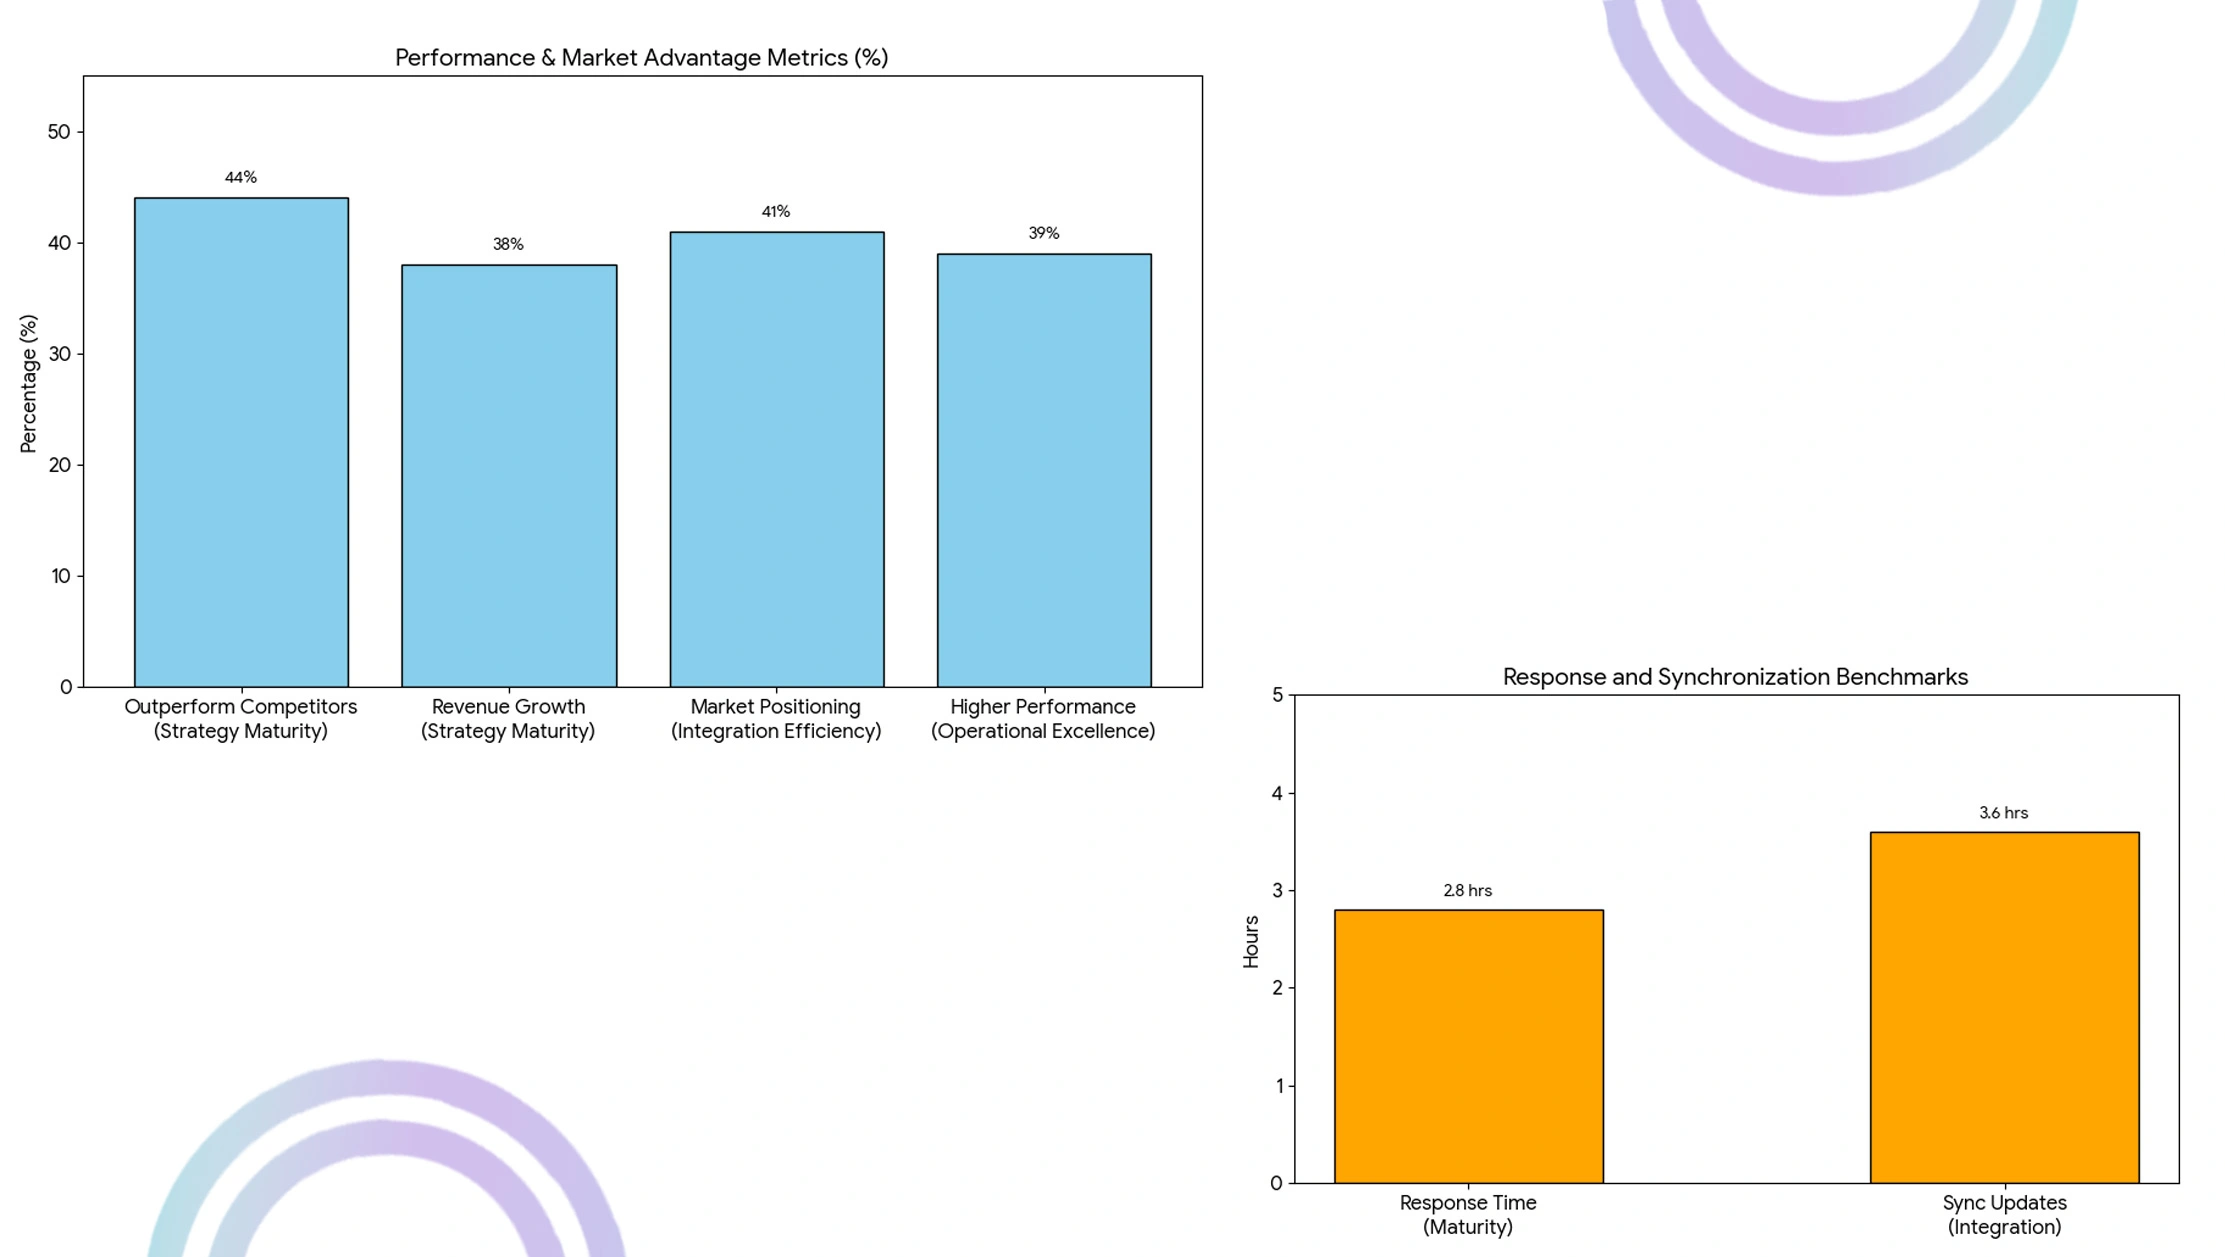
- Pricing Strategy Maturity
Organizations implementing adaptive valuation and responding within 2.8 hours outperform competitors by 44%, achieve 38% greater revenue, and generate an additional ₹10,200 per month per location, reflecting the Indian Property Market Forecast Residential vs Commercial dynamics. - Information Integration Efficiency
Top performers synchronize updates within 3.6 hours, emphasizing the importance of seamless integration. Delays can cost medium-sized firms ₹920 daily, while efficient infrastructure boosts market positioning by 41% and delivers up to ₹126,000 more in annual revenue per operational center. - Operational Excellence Benchmarks
Managing 26–32 daily pricing modifications yields a 39% higher performance and ₹6,400 in additional monthly value. Yet, 46% face deployment challenges, losing ₹3,500 monthly, making robust operational frameworks vital for sustained profitability.
Conclusion
Elevate your property investment approach by using reliable market intelligence that delivers accurate, real-time insights for smarter decision-making across India’s fast-changing real estate environment. With a clear view of Indian Property Market Forecast Residential vs Commercial, shifting demand patterns, and high-potential growth zones, industry leaders can adapt faster, reduce risk, and stay ahead in an increasingly competitive market.
By analyzing City Wise Residential and Commercial Trends, investors and real estate professionals can identify high-performing locations, anticipate future demand, and act on opportunities before competitors do. Contact Web Fusion Data today and redefine how you evaluate, optimize, and expand your real estate portfolio for maximum returns.