Introduction
In today’s fast-moving quick commerce and food delivery ecosystem, pricing is no longer uniform across an entire city. Even within the same neighborhood, users may see different prices depending on their delivery address. For delivery platforms, such differences are not random; they reflect operational costs, demand patterns, store availability, and competitive positioning.
Businesses that depend on delivery apps need more than just city-level insights. They require detailed monitoring of micro-market shifts to understand where pricing changes occur and why. This is where Food Delivery Data Intelligence becomes essential, helping brands and aggregators evaluate pricing patterns at a much deeper geographic level.
With the rise of rapid delivery services, companies are now using Pincode Level Pricing Analysis for Delivery Apps to track how product costs vary across zones, identify profitable micro-locations, and spot inconsistencies in promotions. These insights allow businesses to make better pricing decisions and adapt strategies based on local demand behavior.
Key Reasons Behind Localized Price Shifts
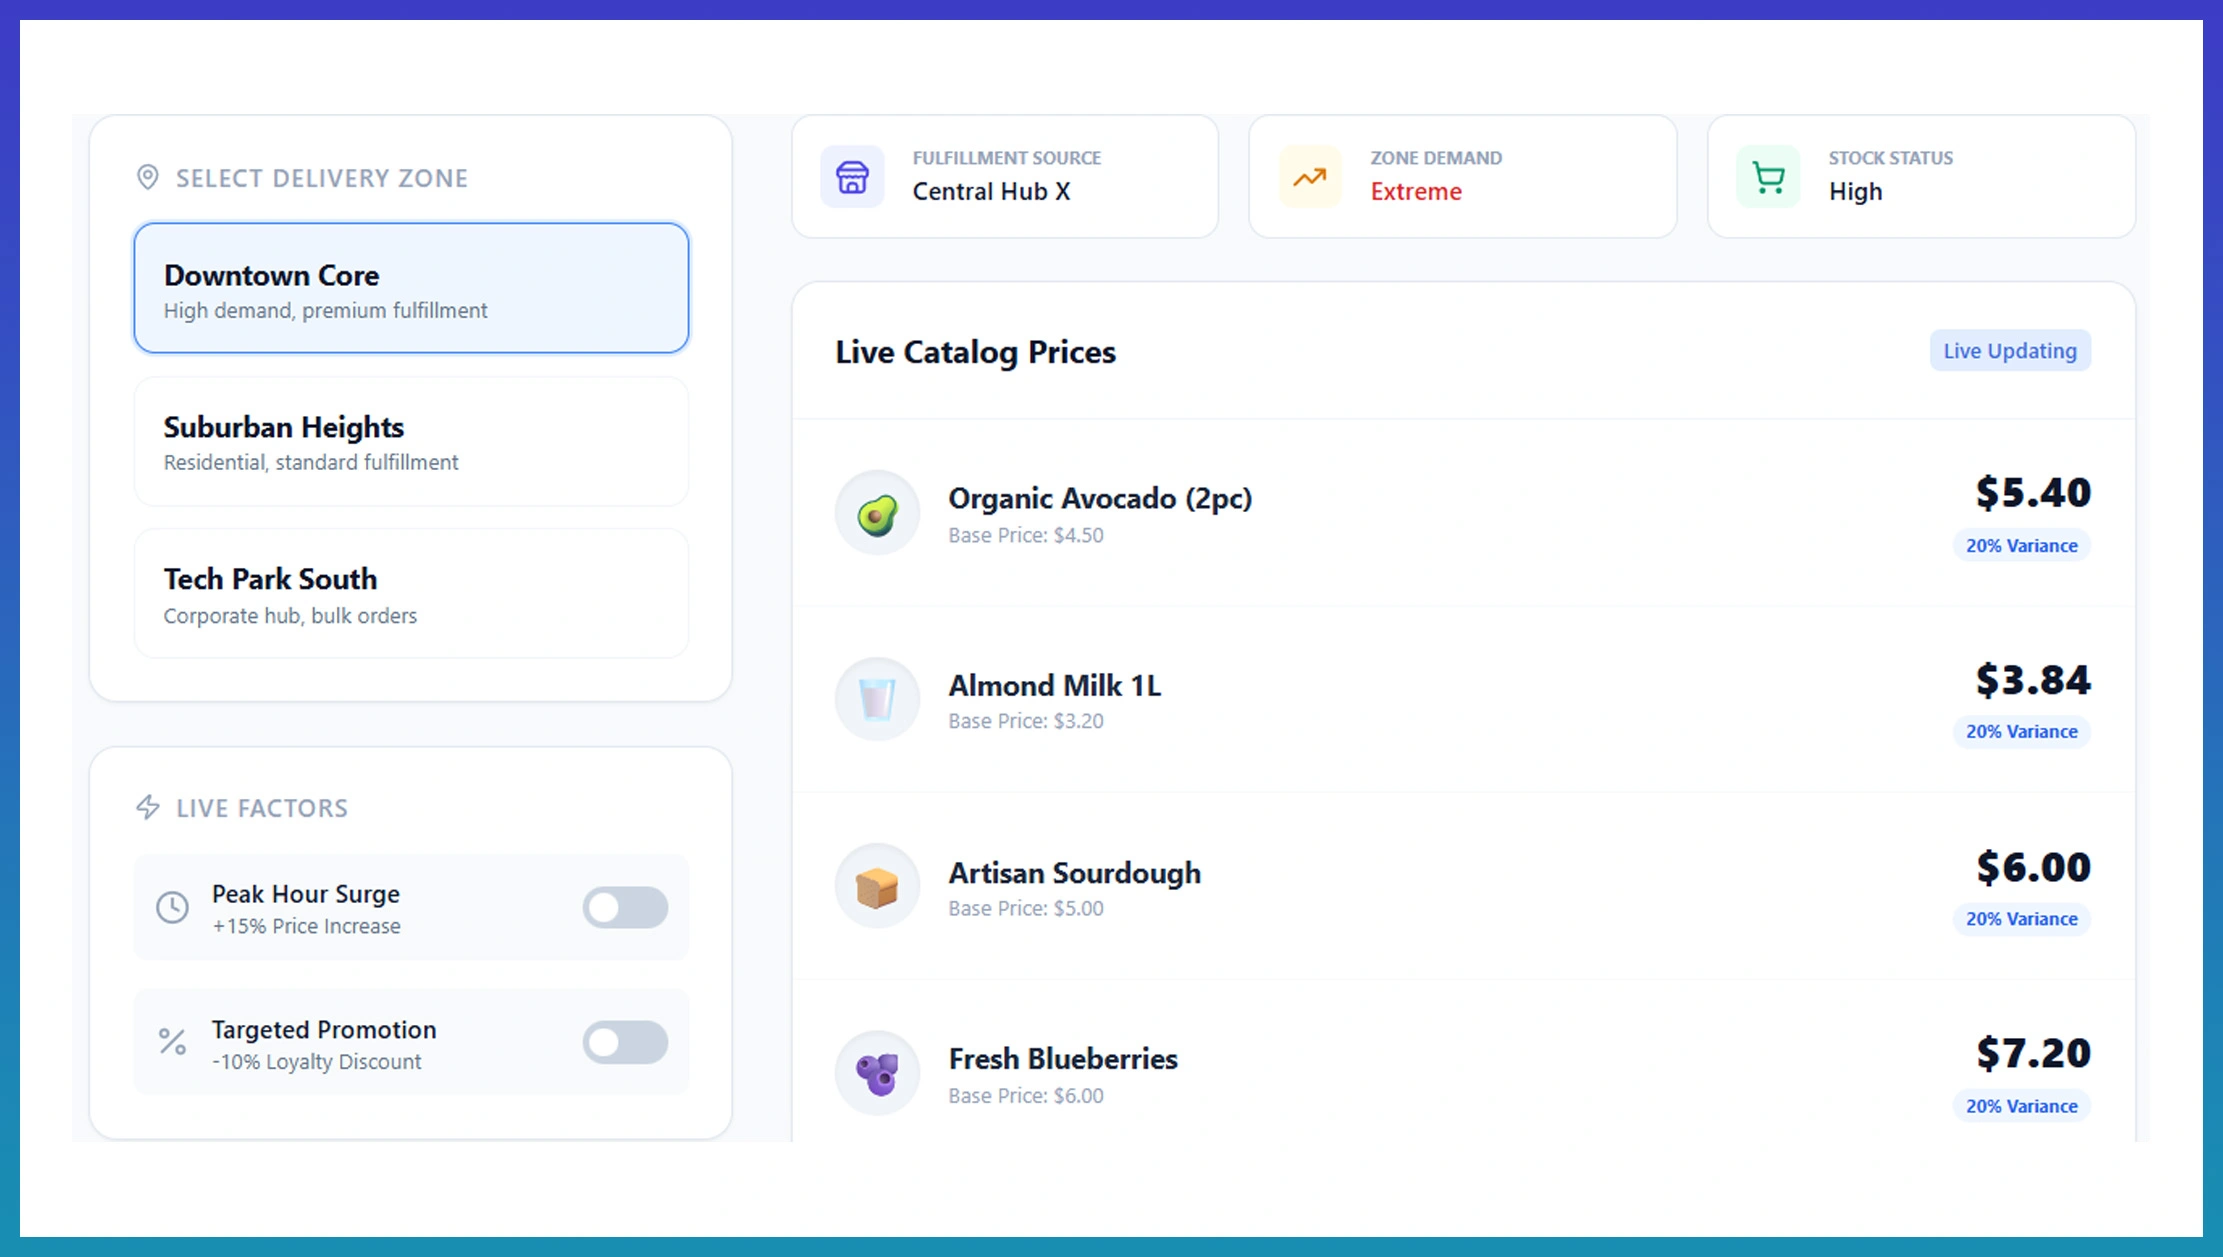
Delivery apps today follow highly dynamic pricing models where product rates fluctuate based on local demand, stock availability, and delivery feasibility. This is why Hyperlocal Delivery App Price Variation by Location has become a major pricing reality in urban markets.
One of the primary reasons for localized price differences is the assignment of different dark stores or partner outlets to specific pin codes. Even when two neighborhoods are geographically close, the backend fulfillment source may vary, resulting in noticeable price gaps.
Time-based demand spikes also play a critical role. During peak lunch and dinner hours, certain localities experience higher order volumes, which often leads to temporary price increases driven by demand pressure.
In addition, delivery apps frequently run targeted discounts to test consumer behavior and boost conversion rates in selected zones. These app-driven campaigns are typically supported by Pricing and Promotion Services, ensuring that offers are selectively applied based on performance metrics and demand trends.
By closely analyzing these factors, businesses can better understand pricing inconsistencies and respond with more effective local strategies. Recent studies suggest that micro-market price fluctuations can range between 10% and 25%, depending on competition intensity and operational load.
Comparison of Pricing Monitoring Approaches
| Monitoring Capability | Limited Coverage | Continuous Framework |
|---|---|---|
| Operating Hours | Fixed schedules | 24/7 coverage |
| Regional Visibility | Fragmented | Unified |
| Data Latency | High | Minimal |
| Strategic Readiness | Reactive | Proactive |
Why City-Level Insights Fail to Explain Reality
Many brands still depend on city-level pricing averages to measure performance and competitiveness. However, city-wide reporting often hides the most valuable insights because it merges multiple micro-markets into a single number. This is why City Wise vs Pincode Wise Price Comparison has become a necessary approach for accurate market evaluation.
A city may appear stable in terms of average pricing, yet specific localities within that same city can experience significant fluctuations. These variations are often driven by demand density, store allocation models, delivery distance, and localized operational costs. When all zones are averaged together, these important pricing signals disappear.
In high-demand neighborhoods, products may be priced higher because platforms recognize stronger purchase intent and lower discount dependency. On the other hand, price-sensitive areas may experience more aggressive promotions to drive conversions.
Fulfillment infrastructure also differs across pincodes. Some areas are served by nearby warehouses or dark stores, while others rely on partner outlets located farther away, increasing operational complexity and affecting final product pricing. Research indicates that discount sensitivity can vary by as much as 30% between dense residential clusters and premium zones, clearly demonstrating that consumer behavior is highly localized.
A localized tracking approach improves pricing accuracy and ensures brands respond to real consumer experience rather than misleading averages. Companies that monitor hyperlocal patterns can identify zones requiring price corrections and avoid unnecessary discount leakage.
Difference Between Broad and Micro-Level Tracking
| Monitoring Capability | Limited Coverage | Continuous Framework |
|---|---|---|
| City-Level View | Wide average | Medium accuracy for general benchmarking |
| Pincode-Level View | Hyperlocal coverage | High accuracy for price optimization |
| Zone Clustering | Area-based grouping | High relevance for store & supply planning |
| Discount Monitoring | Offer-focused tracking | High precision for campaign effectiveness |
Competitive Patterns Hidden Inside Local Markets

Competitive pricing on delivery apps is rarely uniform across an entire city. Platforms continuously adjust prices based on demand signals, competitor presence, and localized buying behavior. Insights from Swiggy Pincode Wise Pricing Analysis frequently reveal that pricing and discount intensity can vary sharply across zones depending on order density, fulfillment reach, and outlet concentration.
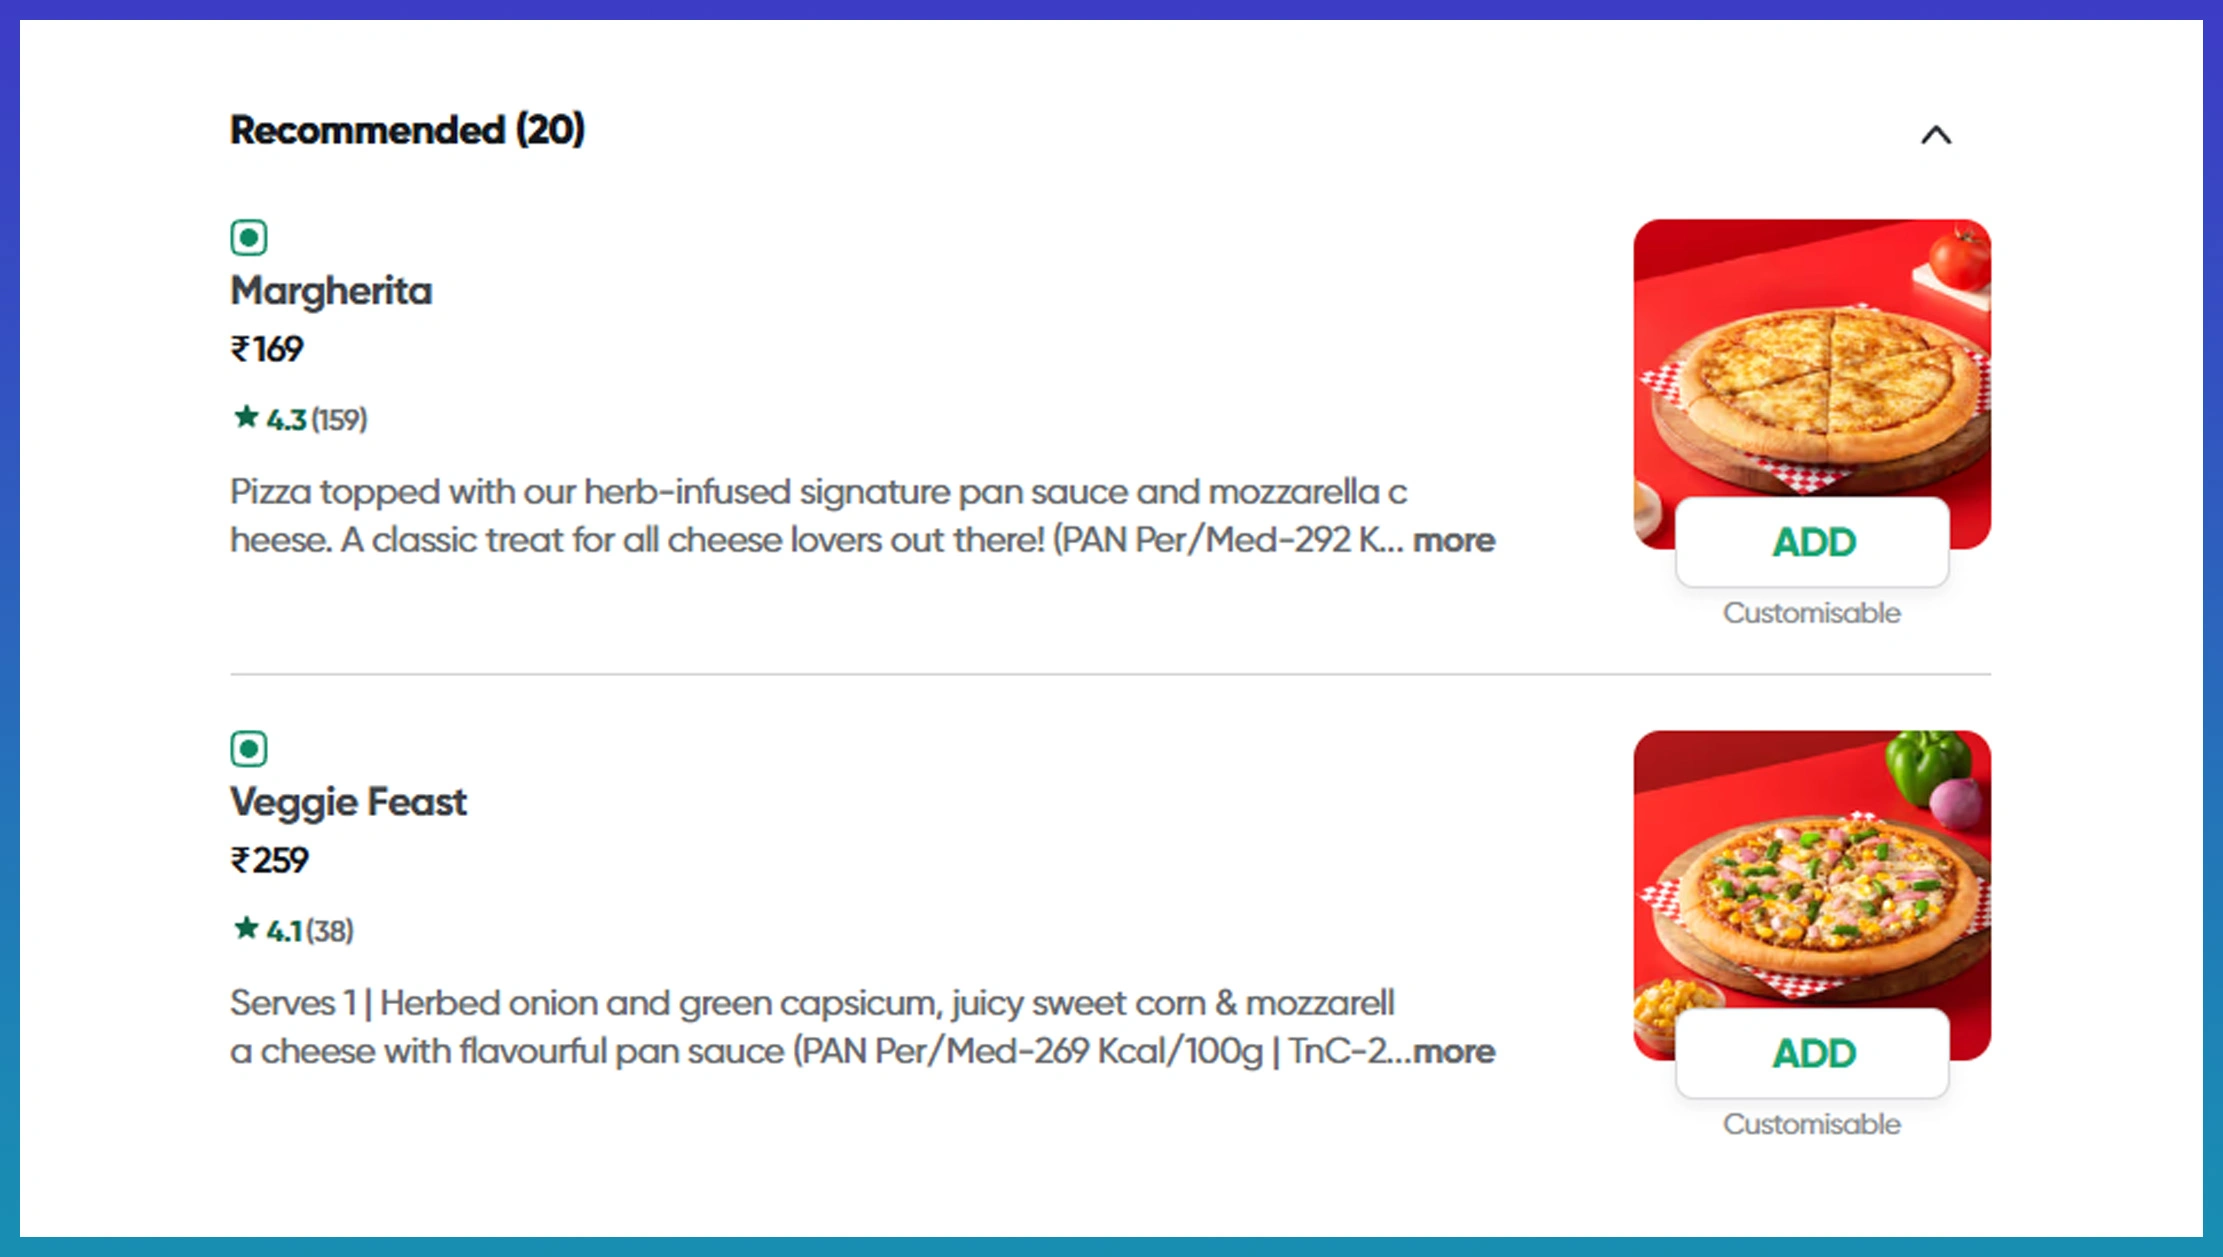
Similarly, Zomato Price Differences by Pincode highlight how restaurants and cloud kitchens apply locality-based menu rates. Some pincodes may reflect higher packaging charges or delivery fees, while others are pushed with aggressive discounts to capture user attention and increase order frequency.
The rise of quick commerce has intensified this competitive behavior even further. Data from Blinkit Pricing Variation by Location shows that essential categories such as snacks, beverages, and groceries often experience price shifts driven by warehouse proximity, stock movement, and replenishment cycles.
These hyperlocal pricing adjustments are largely invisible at a city-average level but play a decisive role in consumer choice and platform switching. Understanding these dynamics allows brands to respond faster, defend margins, and fine-tune local pricing strategies. Research indicates that nearly 35% of users are likely to switch platforms after repeatedly noticing price differences for similar products.
Platform-Level Competitive Pricing Insights
| Platform Data Focus | What It Highlights | Business Value |
|---|---|---|
| Swiggy Tracking | Discount intensity by area | Better promotion planning |
| Zomato Monitoring | Local menu pricing patterns | Improved price consistency |
| Blinkit Mapping | Stock-driven price shifts | Smarter inventory decisions |
| Cross-App Comparison | Price gaps across platforms | Stronger market positioning |
How Web Fusion Data Can Help You?
Modern delivery pricing changes faster than most brands can track manually. We help businesses monitor market movement and competitive shifts by collecting structured insights through Pincode Level Pricing Analysis for Delivery Apps across multiple delivery platforms.
We support businesses with:
- localized product pricing monitoring across delivery apps.
- real-time discount tracking for competitive benchmarking.
- delivery fee and packaging charge mapping.
- pincode-level availability and stock shift monitoring.
- promotional pattern reporting across time slots.
- structured dashboards for strategic planning.
To strengthen market accuracy, we also provide insights based on Hyperlocal Delivery App Price Variation by Location, ensuring businesses understand why price differences happen and how they impact local conversions.
Conclusion
Businesses that rely solely on broad city-level averages often overlook the micro-market shifts that directly influence revenue, profitability, and customer loyalty. With Pincode Level Pricing Analysis for Delivery Apps, brands gain visibility into real pricing behavior at the ground level, enabling them to reduce margin leakage and make data-driven decisions across delivery platforms.
Simultaneously, consistent City Wise vs Pincode Wise Price Comparison allows companies to pinpoint which areas require price corrections, which zones are more promotion-sensitive, and where competitive pressure is strongest. A hyperlocal pricing approach ensures that strategies are aligned with actual consumer behavior rather than misleading averages.
Contact Web Fusion Data today to develop smarter hyperlocal pricing strategies and transform delivery app data into measurable, sustainable business growth.