Introduction
Grocery operations increasingly depend on timely signals to understand what shoppers may need next. Combining order patterns, product availability, basket composition, delivery speed, and location-level demand creates a practical foundation for better inventory decisions. Grocery Demand for Predictive Analytics Use Quick Commerce Data helps connect these signals with replenishment planning.
Quick commerce platforms generate frequent changes in product movement, prices, availability, and customer preferences. These signals can help retailers identify recurring demand cycles, regional differences, and products that require faster replenishment. Grocery Demand Forecasting Using Quick Commerce Data supports more structured planning when fresh market signals are incorporated into forecasting workflows.
With organized data pipelines, grocery businesses can compare demand patterns across time, categories, and locations while reducing reliance on static assumptions. Quick Commerce Data Intelligence also helps teams interpret fast-moving signals and convert them into practical inventory actions, particularly when seasonal shifts or localized buying behavior create planning pressure.
Strategic Signals Shaping More Accurate Grocery Inventory Planning Decisions
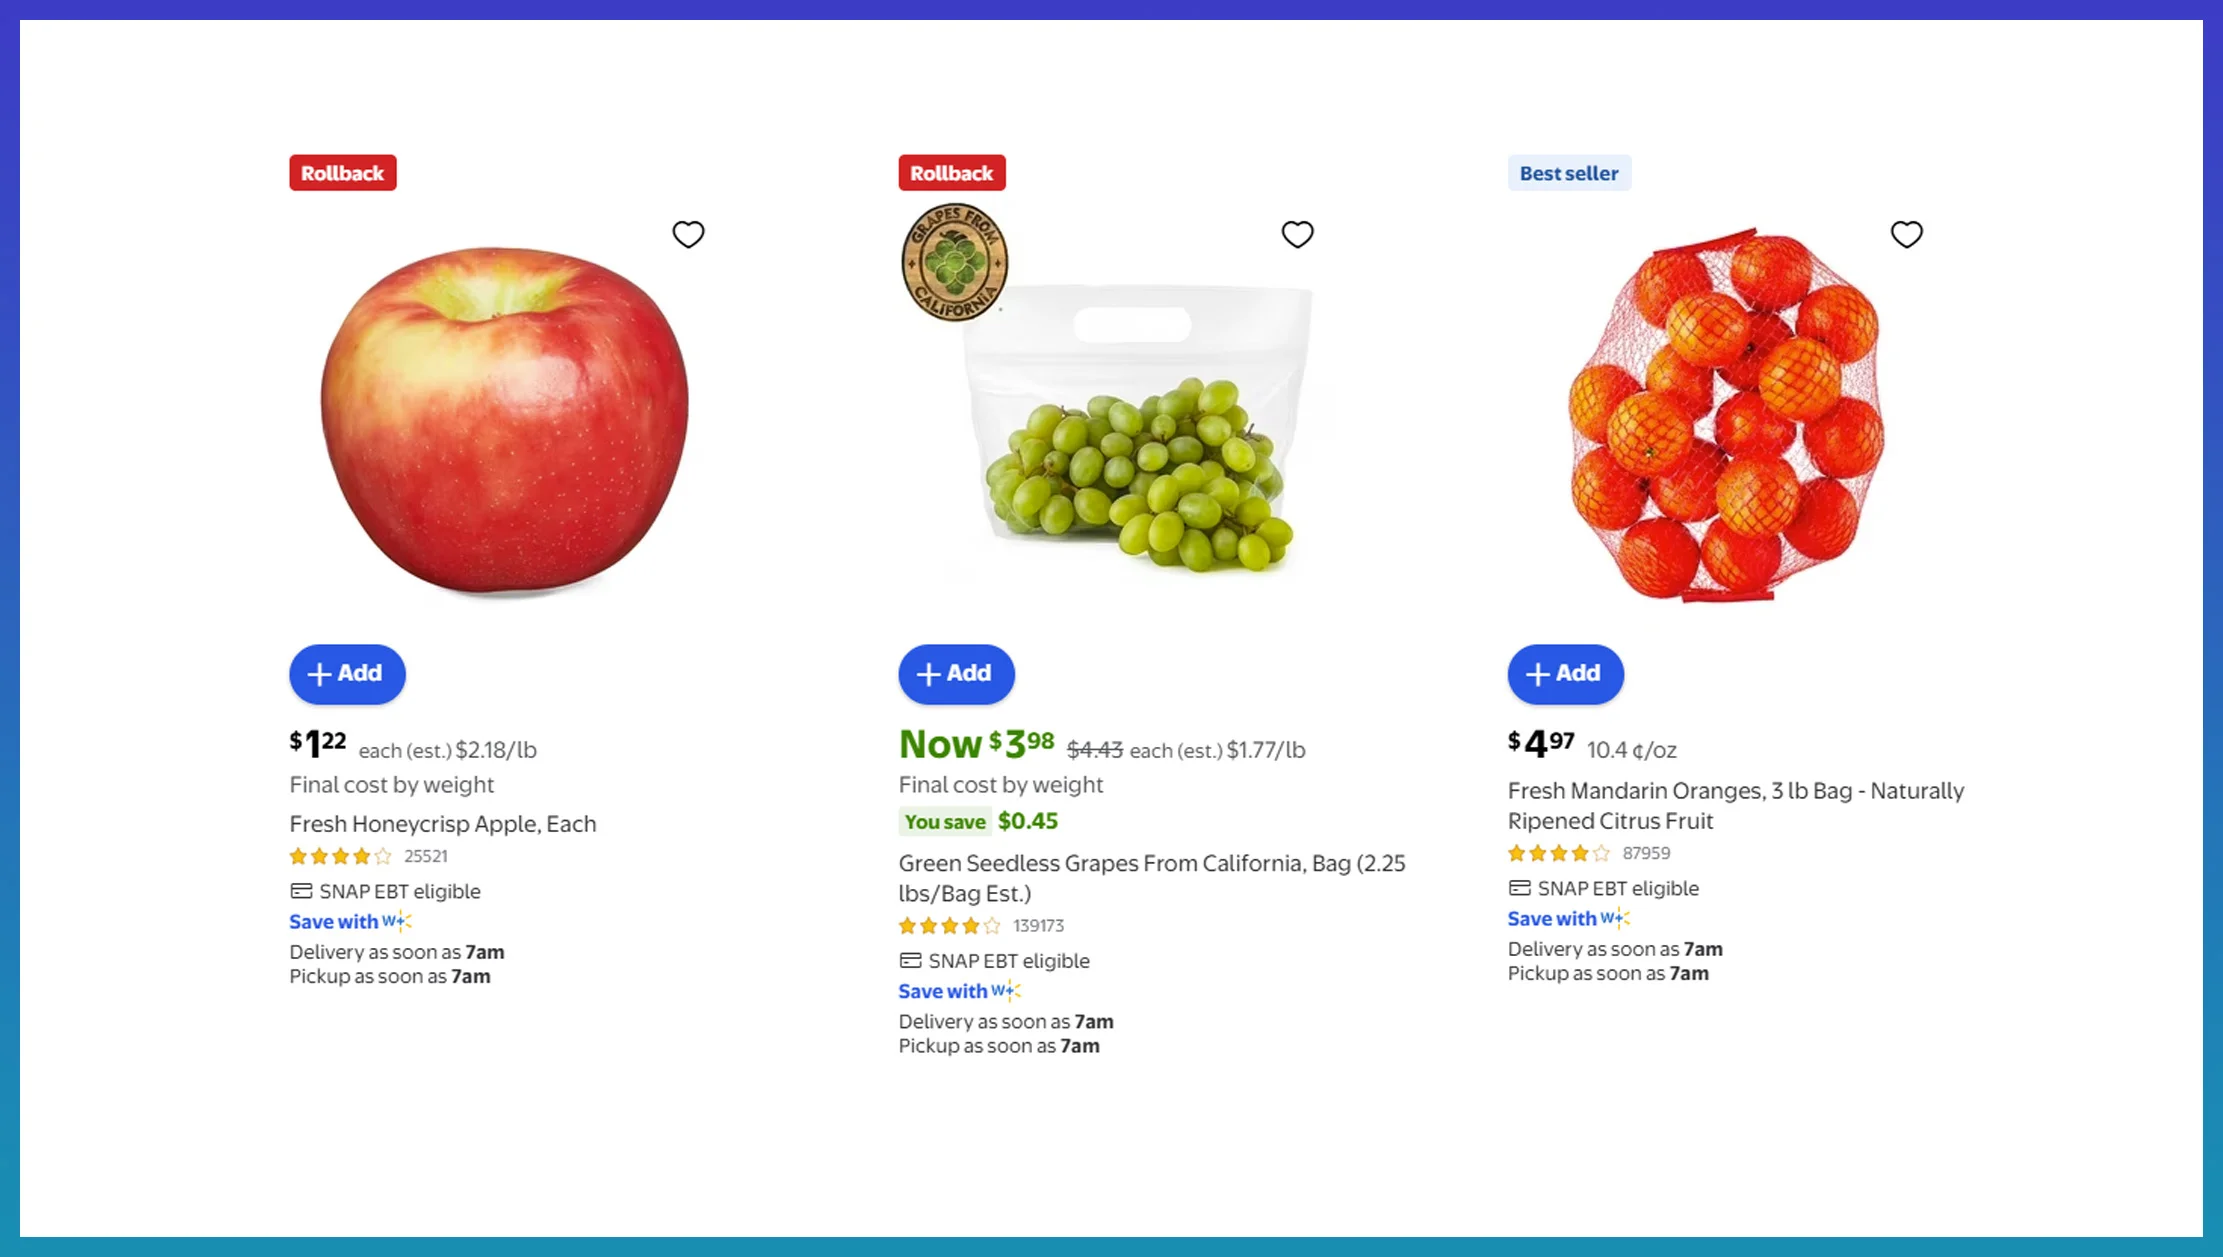
Demand planning becomes more precise when retailers examine product-level movement instead of relying only on historical sales averages. Product names, categories, prices, availability, ratings, and location-level observations can be organized into structured Grocery Datasets for recurring analysis. This allows planning teams to identify frequently purchased items, changing category preferences, and products requiring closer inventory attention.
Fast-moving grocery categories require frequent observation because small changes in customer behavior can quickly affect stock requirements. Grocery Demand Forecasting Using Quick Commerce Data can help teams connect observed product movement with replenishment schedules, category planning, and warehouse allocation. Instead of treating every sales increase as permanent demand growth, analysts can compare repeated patterns across multiple periods and locations.
| Demand Signal | Planning Application |
|---|---|
| Product movement | Identifies frequently purchased products |
| Stock availability | Indicates replenishment pressure |
| Category activity | Highlights changing preferences |
| Location patterns | Supports area-specific allocation |
Regional differences can also influence how inventory should be distributed. A product showing strong movement in one service area may not demonstrate the same pattern elsewhere. Reviewing location-specific observations helps retailers avoid applying broad assumptions to every market and provides additional context for purchasing decisions.
- Monitor recurring product movement
- Compare category-level demand changes
- Review local purchasing patterns
- Identify products requiring faster replenishment
When these signals are evaluated together, teams can build a more organized view of grocery demand and reduce dependence on isolated sales observations. The resulting analysis can support purchasing, assortment planning, inventory allocation, and replenishment decisions across different service locations.
Connecting Price And Availability Changes With Inventory Decisions

Price and availability changes provide valuable context for understanding grocery purchasing behavior. Web Scraping Solutions can support this process by organizing information from multiple quick commerce sources into consistent fields. Analysts can then compare pricing movements, stock status, and product visibility to determine whether changes reflect promotions, supply conditions, or stronger customer interest.
Promotional activity can create temporary demand increases that may otherwise appear similar to sustained growth. Grocery Price Monitoring With Quick Commerce Analytics allows businesses to examine price movements alongside availability and product activity. When a price reduction occurs at the same time as increased product movement, planning teams can consider promotional influence before making longer-term inventory adjustments.
| Market Indicator | Operational Use |
|---|---|
| Price movement | Reviews promotion-related changes |
| Stock status | Highlights supply pressure |
| Product visibility | Supports assortment assessment |
| Delivery availability | Indicates local service conditions |
Availability patterns can also reveal potential supply constraints. If a frequently purchased product repeatedly becomes unavailable in a specific location, planners can review whether replenishment frequency, assortment decisions, or local purchasing behavior contributed to the pattern. Comparing multiple locations makes it easier to distinguish isolated issues from broader market changes.
- Compare recurring price movements
- Track product availability changes
- Review promotion-linked demand shifts
- Assess location-specific supply conditions
Combining these observations creates a broader planning framework for grocery businesses. Rather than analyzing price or stock data separately, teams can evaluate multiple indicators together and determine how each change relates to purchasing behavior. This supports more structured replenishment decisions and helps planners respond to changing market conditions with greater consistency.
Localized Intelligence Driving Responsive Stock Planning Across Service Areas
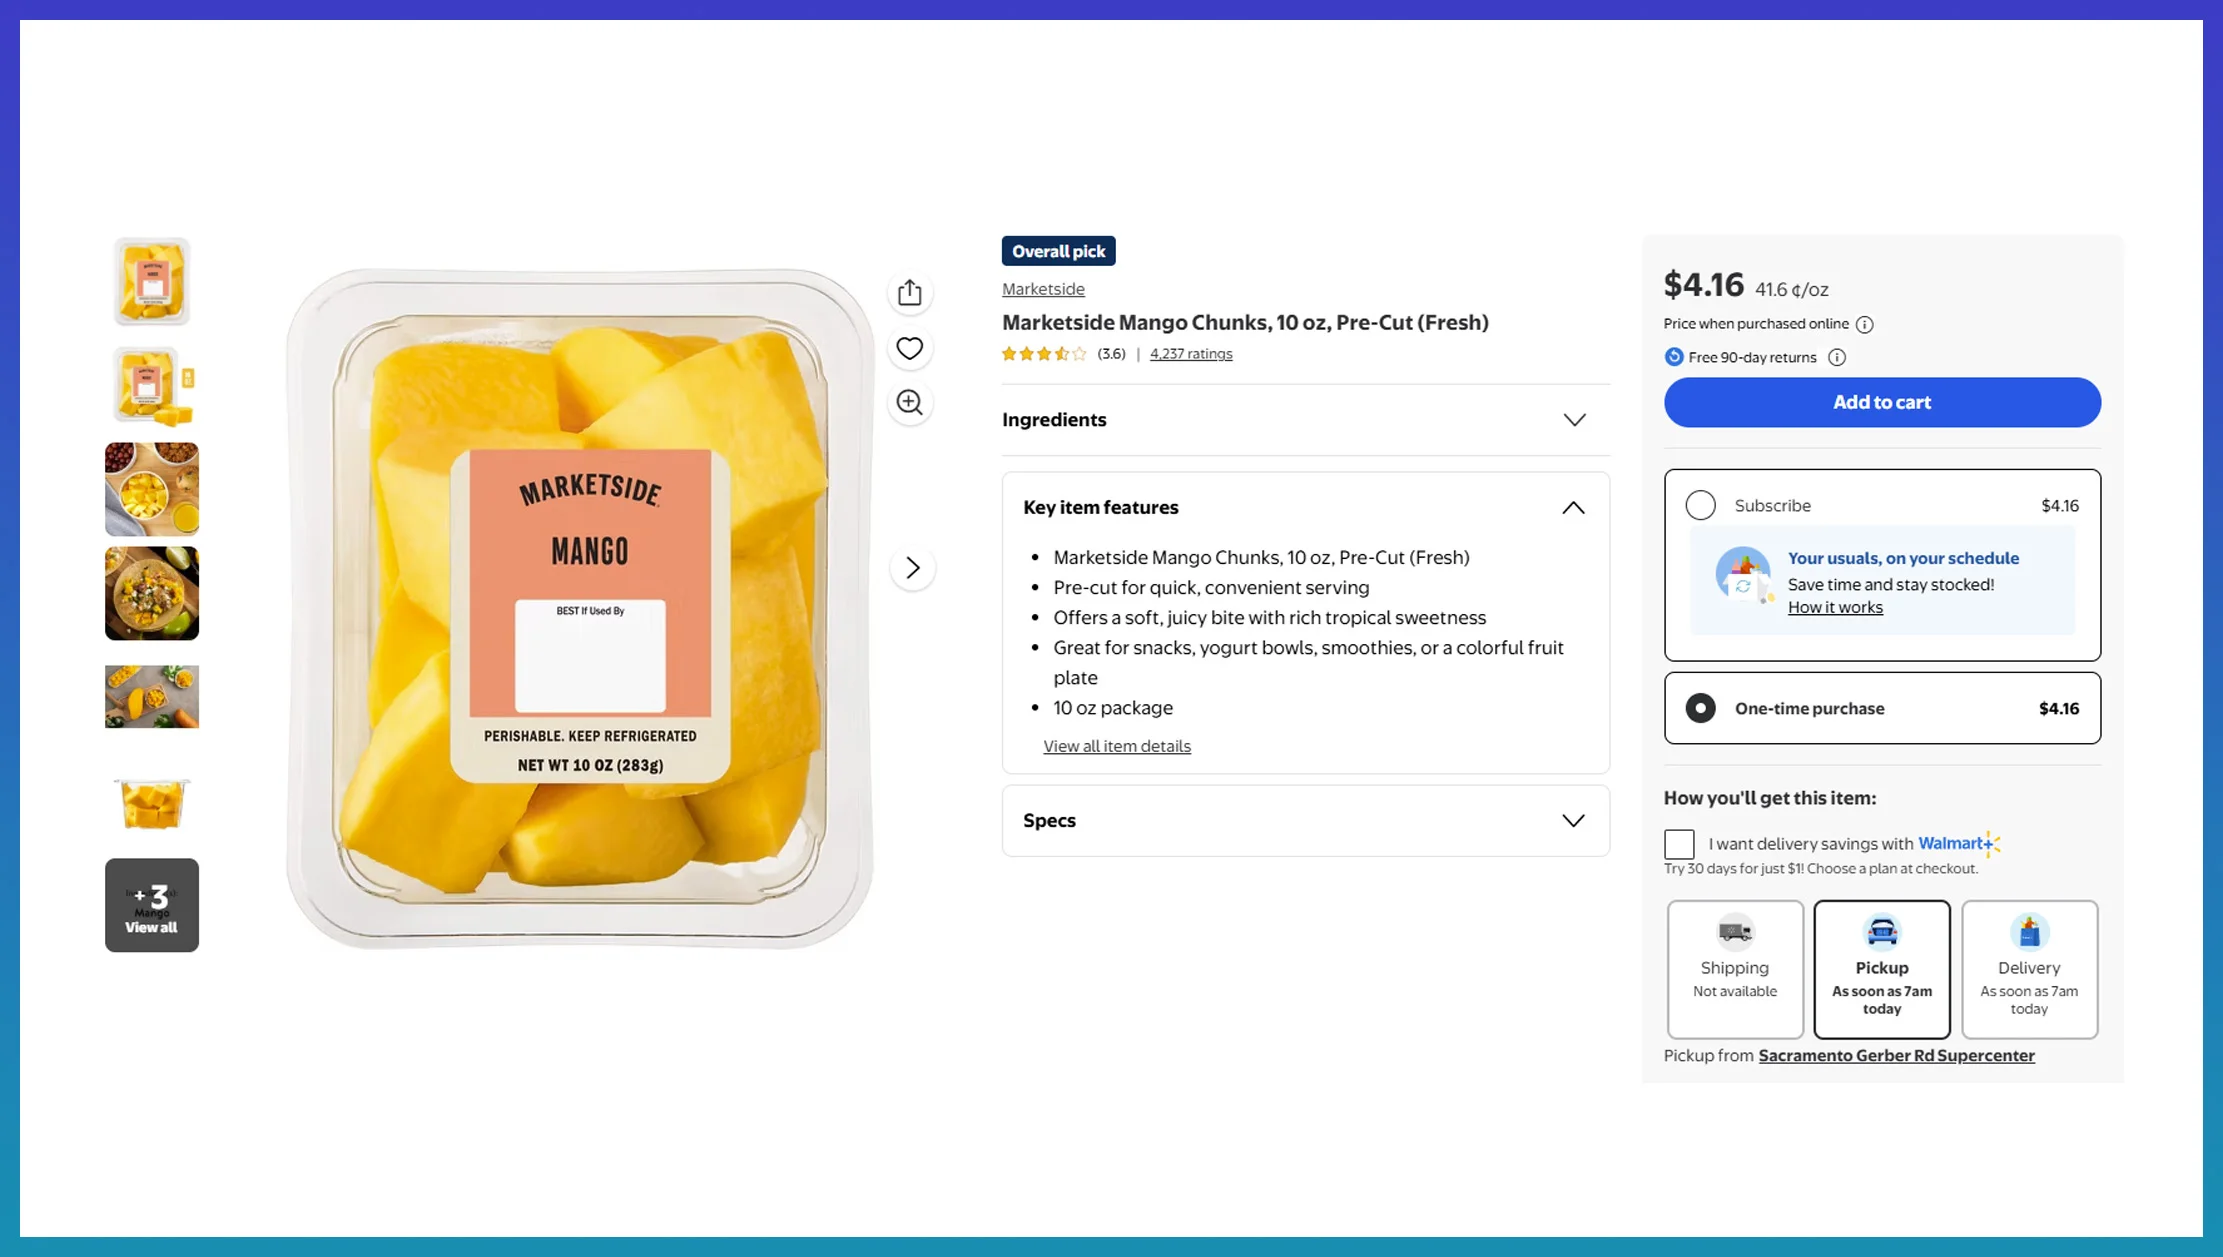
Quick commerce demand can vary considerably between neighborhoods, cities, and service zones. A Grocery Scraper can collect product, category, availability, pricing, and location information at recurring intervals, creating a structured foundation for localized analysis. These observations allow retailers to compare product movement across service areas and identify locations where particular categories require different inventory strategies.
Localized analysis becomes especially useful when customer preferences differ between markets. Quick Delivery App Data Scraping for Grocery Trend Analysis can provide recurring observations that help teams examine changing product interest, category movement, and local availability. Comparing these signals over several periods can reveal whether an increase is temporary or part of a recurring pattern. Such information can contribute to store-level assortment decisions and fulfillment planning.
| Local Indicator | Operational Application |
|---|---|
| Area-level movement | Supports localized inventory allocation |
| Category activity | Guides assortment adjustments |
| Stock changes | Helps prioritize replenishment |
| Delivery patterns | Indicates service-area demand |
Location-based comparisons can also help businesses identify products that consistently perform differently across service zones. Instead of applying a single inventory model to every market, planners can consider local demand characteristics when determining stock levels. This can improve alignment between available inventory and observed purchasing behavior.
- Compare demand across service areas
- Identify location-specific category patterns
- Review recurring stock changes
- Adjust replenishment priorities by market
A localized approach provides greater context for inventory planning because it considers where demand occurs rather than focusing only on aggregate figures. When recurring observations are organized systematically, grocery businesses can evaluate market differences, refine assortment decisions, and improve the timing of replenishment activities across individual service areas.
How Web Fusion Data Can Help You?
Grocery planning requires reliable information that can be collected consistently and converted into practical operational signals. Grocery Demand for Predictive Analytics Use Quick Commerce Data can support this process by bringing product, pricing, availability, category, and location observations into a structured analytical workflow.
We can support grocery-focused data projects through organized collection, processing, cleaning, and delivery workflows designed around specific business requirements.
- Define relevant grocery categories and product attributes
- Identify suitable quick commerce data sources
- Collect recurring product and market observations
- Standardize inconsistent fields across multiple sources
- Organize datasets for analytical and forecasting workflows
- Deliver structured outputs for business intelligence systems
The resulting data can support recurring research across assortment planning, demand analysis, pricing evaluation, and inventory management. Grocery Data Scraping Services for Demand Analytics Companies can further support organizations that require dependable data collection at scale while maintaining consistent structures for ongoing analysis.
Conclusion
Effective stock planning depends on timely information about what customers purchase, where demand changes, and how product availability shifts. Grocery Demand for Predictive Analytics Use Quick Commerce Data provides a structured approach for connecting these signals with inventory decisions, helping teams evaluate demand patterns using consistent market observations.
When pricing, availability, category movement, and local demand are analyzed together, planning becomes more responsive to changing conditions. Quick Delivery App Data Scraping for Grocery Trend Analysis can provide additional market signals for recurring evaluation and operational planning. Request a custom grocery data solution from Web Fusion Data to strengthen your inventory intelligence workflow.