Introduction
Understanding hyper-local retail dynamics requires visibility into how major chains adjust costs across diverse neighborhoods. By implementing Walmart Price Tracking by Zip Code, brands and analysts can see beyond national averages to understand exact pricing shifts at individual storefronts across the United States.
Retailers constantly calibrate shelf values based on local competition, regional logistics costs, and shifting consumer demand. Integrating a reliable Walmart Price Monitoring API enables businesses to capture these automated fluctuations in real time without manual store checks or delayed quarterly reports.
Tracking over 4,700 physical locations reveals clear correlations between sudden price markdowns and dwindling stock reserves. When automated systems monitor shelf prices alongside regional fulfillment capabilities, companies can predict replenishment cycles and protect profit margins across every metropolitan and rural market.
Regional Price Shifts Expose Local Stock Depletion Patterns
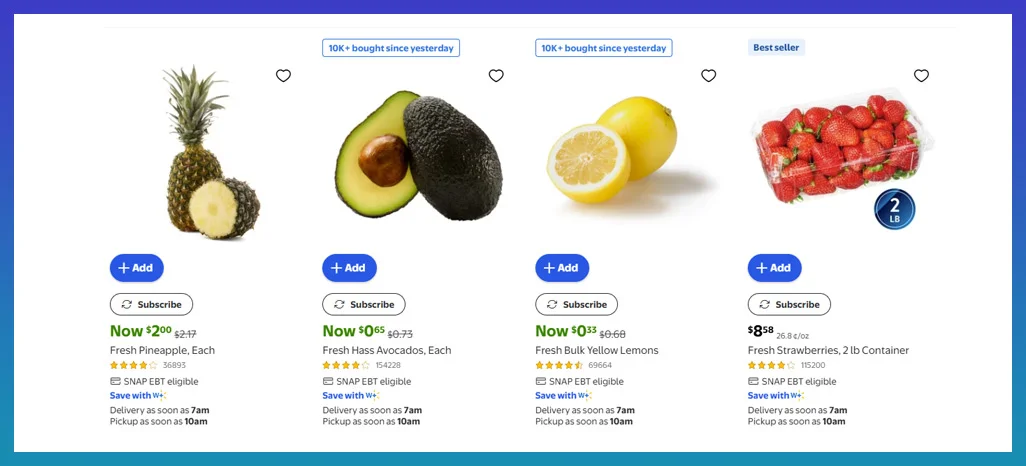
Analyzing granular storefront pricing exposes how localized demand directly dictates shelf values across different states and metropolitan regions. When analysts utilize Walmart Store Level Price Tracking, they observe that identical items frequently vary by 8% to 15% between neighboring postal codes due to warehouse proximity and local competitor density. Whenever a specific storefront initiates an unadvertised 12% rollback, it often signals an impending clearance event ahead of seasonal catalog resets.
Executing large-scale Walmart Product Data Scraping across all 4,700+ US branches demonstrate that rapid price drops precede out-of-stock events by an average of 72 hours. Conversely, sudden price increases of 4% to 7% typically occur when regional distribution centers experience replenishment bottlenecks, prompting local managers to throttle unit velocity until restock trucks arrive at the loading dock.
- Sudden mid-week price rollbacks of 10% or more strongly indicate localized overstock or upcoming planogram transitions.
- Incremental upward price adjustments often reflect tight regional warehouse reserves and higher last-mile freight expenses.
- Weekend promotional discounts accelerate unit movement by up to 28% in high-density suburban retail corridors.
| Store Region Category | Average Item Price Variance | Out-of-Stock Lead Time After Markdown | Restock Cycle Duration |
|---|---|---|---|
| Urban Metro Hubs | ±11.4% | 48–60 Hours | 3–4 Days |
| Suburban Retail Centers | ±8.2% | 72–84 Hours | 5–6 Days |
| Rural and Remote Markets | ±14.8% | 96+ Hours | 7–10 Days |
Combining these regional pricing patterns with Walmart Inventory Tracking allows suppliers to distinguish between genuine consumer demand surges and deliberate clearance strategies. Brands that monitor both metrics simultaneously avoid misinterpreting localized markdowns as national market devaluation, ensuring smarter promotional budgeting and accurate supply allocation across every territory.
Connecting Fulfillment Speed With Hyper-Local Shelf Stock Levels
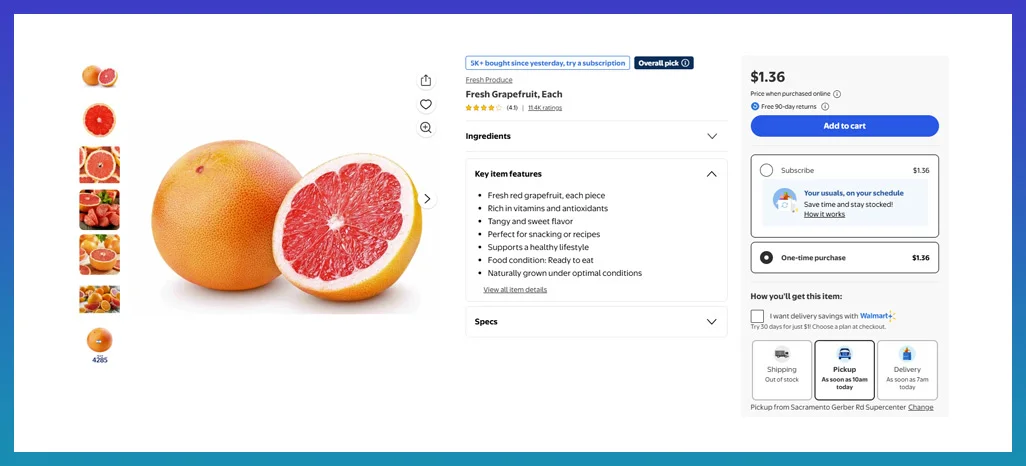
Modern omnichannel retail relies heavily on store-level fulfillment for curbside pickup and same-day delivery orders across thousands of communities. When enterprises deploy Walmart Product Availability by Zip Code, they uncover critical gaps between online catalog listings and actual backroom stock across distinct postal zones. Recent retail benchmarks indicate that roughly 18% of high-velocity consumer packaged goods experience localized stockouts during peak weekend shopping windows, even when regional warehouses report healthy surpluses.
Connecting internal enterprise systems to a robust Walmart Product Data API allows category managers to monitor exact unit counts, pickup eligibility, and delivery surcharges across individual storefronts. Data collected from 4,700+ locations shows that stores dipping below a 15% safety-stock threshold automatically disable third-party delivery options while maintaining higher in-store shelf prices to preserve remaining units for walk-in shoppers.
- High-demand essentials frequently transition to in-store pickup only once backroom reserves fall below critical thresholds.
- Same-day delivery eligibility serves as a reliable real-time proxy for healthy storefront shelf depth across urban zones.
- Discrepancies between digital catalog status and physical shelf presence cost national brands millions in missed conversions annually.
| Inventory Threshold Tier | Online Pickup Status | Dynamic Price Adjustment | Average Store Recovery Rate |
|---|---|---|---|
| High Stock (Above 50% Capacity) | Active / Same-Day | Base or Promotional (-5%) | Standard Weekly Delivery |
| Moderate Stock (15%–50%) | Active / Next-Day | Standard MSRP (0%) | 4-Day Replenishment |
| Low Stock (Below 15% Capacity) | Restricted / In-Store Only | +3% to +6% Surge Buffer | Priority Express Restock |
Extracting structured Walmart Store Inventory Data on a daily cadence empowers suppliers to detect phantom inventory issues where digital systems display stock that is physically missing from aisles. Identifying these discrepancies early prevents lost sales and ensures timely store-level audits before customer loyalty erodes in competitive markets.
Competitive Benchmarking Drives Automated Store Replenishment Forecasting Strategies

Maintaining competitive shelf positioning requires continuous visibility into how regional rivals influence local pricing and stock turnover across diverse territories. Organizations adopting Localized Retail Price Monitoring discover that storefronts located within a three-mile radius of major discount competitors adjust shelf values 3.4 times more frequently than isolated rural branches. These rapid micro-adjustments directly impact stock turnover rates, often accelerating sell-through by up to 22% during promotional weekends.
Integrating advanced Walmart Product Availability Intelligence transforms raw shelf metrics into predictive supply chain forecasts across diverse geographic regions. When historical stock depletion rates are cross-referenced with local weather events, pay-day cycles, and regional holidays, manufacturers can anticipate stockouts up to ten days in advance and reroute shipments to high-demand postal zones.
- Storefronts near rival big-box retailers exhibit shorter replenishment cycles due to aggressive promotional price matching.
- Weather alerts and regional events trigger predictable stock depletion spikes across staple food and household categories.
- Automated competitor price tracking helps brands adjust trade spend dynamically before rival promotions capture market share.
| Competitive Proximity | Weekly Price Changes per Item | Sell-Through Velocity Lift | Stockout Risk Index |
|---|---|---|---|
| High Competition (Under 3 Miles) | 3.4 Adjustments | +22.0% | High (31% Probability) |
| Moderate Competition (3–10 Miles) | 1.8 Adjustments | +11.5% | Moderate (18% Probability) |
| Low Competition (Over 10 Miles) | 0.9 Adjustments | +4.0% | Low (9% Probability) |
Deploying a scalable Retail Inventory Monitoring API alongside Store Level Product Availability Tracking ensures that brand teams never miss critical shelf shifts across national retail networks. Rather than reacting to empty shelves weeks later via delayed point-of-sale summaries, businesses gain immediate operational clarity to optimize distribution routes and protect market share nationwide.
How Web Fusion Data Can Help You?
Scaling retail analytics across thousands of distinct postal regions requires dependable data pipelines that deliver clean, structured records without operational bottlenecks. Integrating Walmart Price Tracking by Zip Code into your existing business intelligence stack becomes effortless when powered by enterprise-grade extraction infrastructure tailored for massive geographic coverage.
We provide end-to-end data collection solutions designed to handle millions of daily storefront queries across all 4,700+ US locations:
- Automated daily and hourly extraction schedules tailored to your priority product categories and regional markets.
- Geo-targeted proxy routing that accurately simulates local shopper sessions across every US postal code.
- Clean, normalized JSON and CSV data feeds ready for immediate ingestion into your ERP or BI dashboards.
- Real-time anomaly alerts that notify your team immediately when sudden price drops or stockouts occur.
- Dedicated engineering support to maintain uninterrupted data pipelines despite frequent retail website layout updates.
- Custom compliance frameworks ensure ethical, reliable data acquisition across all monitored digital storefronts.
By combining E-Commerce Data Intelligence with Walmart Store Level Price Tracking, we empower brands and retailers to turn complex regional fluctuations into clear, profitable merchandising decisions.
Conclusion
Navigating modern retail requires looking past broad national averages to understand the unique economic forces shaping every local neighborhood. When brands implement Walmart Price Tracking by Zip Code, they uncover the exact relationship between regional price rollbacks, local competitor pressures, and impending shelf depletion across thousands of storefronts.
Integrating Walmart Inventory Tracking into daily operations ensures that supply chain and pricing teams spot micro-market shifts early, preventing costly stockouts and protecting profit margins across urban, suburban, and rural territories alike. Partner with Web Fusion Data today to automate your hyper-local retail tracking and transform real-time storefront data into your strongest competitive advantage.